Use cases and simulation environment
In the simulation part of the website, users can access individual use cases and run simulations for a given set of input parameters. In the following section, it will be explained in detail on how it works.
Use case 1
The use case 1 deals with the properties of corrosion inhibitors. The final goal is to assess three relevant KPIs:
Inhibition efficiency;
Toxicity;
and Price.
The use case 1 is based on the API connection to the PubChem database. The Database merges more than 750 important international chemical sources such as ECHA, OSHA, etc. For more info please take a look at the following publication: Kim et al. (2020), PubChem in 2021: new data content and improved web interfaces, Nucleic Acids Research.
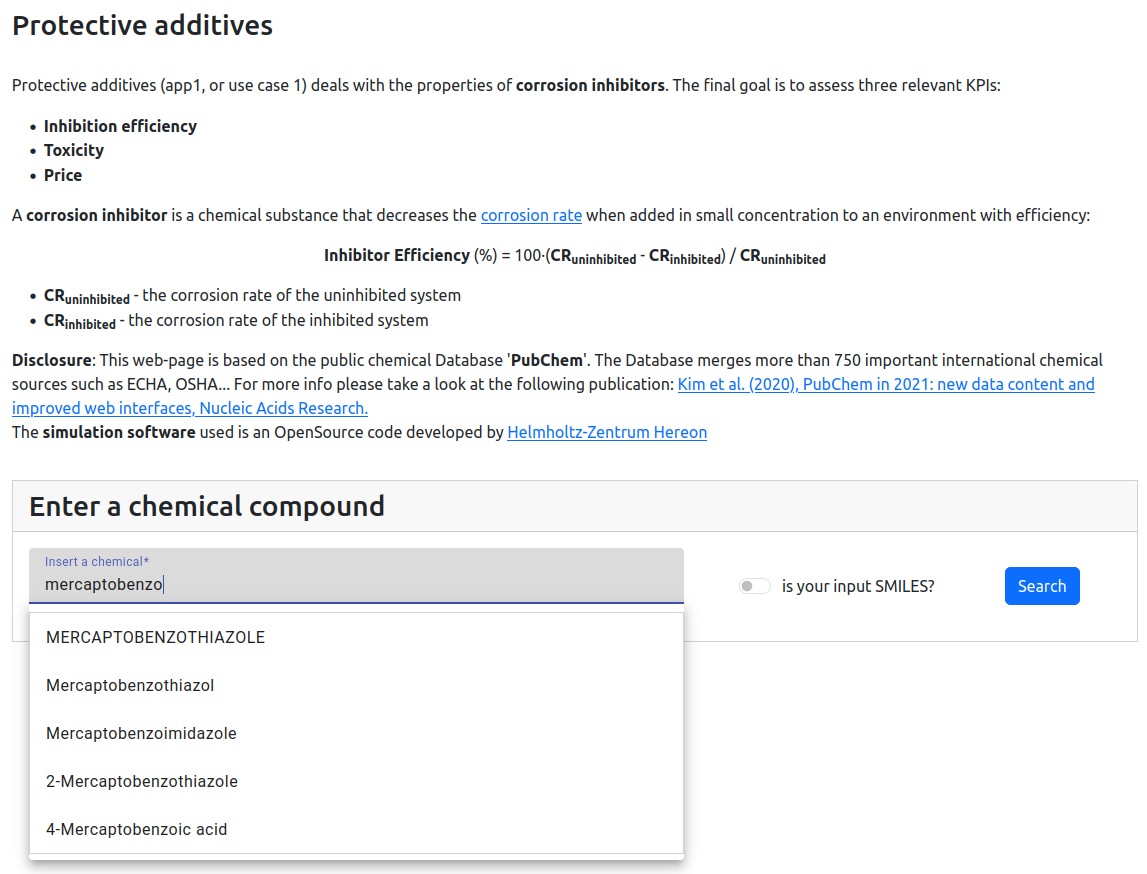
The initial connection is established via the search engine presented when the use case 1 web-page is loaded as shown in the figure below. The search engine accepts inputs in the form of name, CAS number, molecule symbol, or SMILES formula. The connection is made to the pubchem suggestion API. When a user enters at least 4 characters in the search engine, suggestions are presented. This removes issues related with incorrect form of the input and user mistakes. The user can also ignore suggestions and just run the search without accepting any of suggestions.
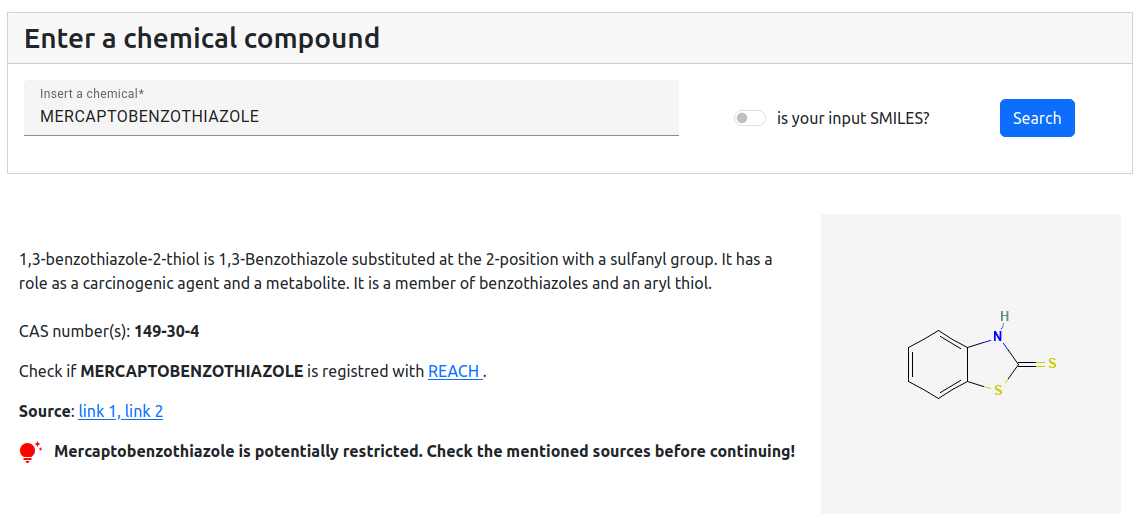
Once the chemical is entered, the web-page presents basic info with the reference to the sources where the information are taken from (the figure below). The basic information include a short description, CAS number, general information on restrictions, and a schematic image of the chemical’s structure.
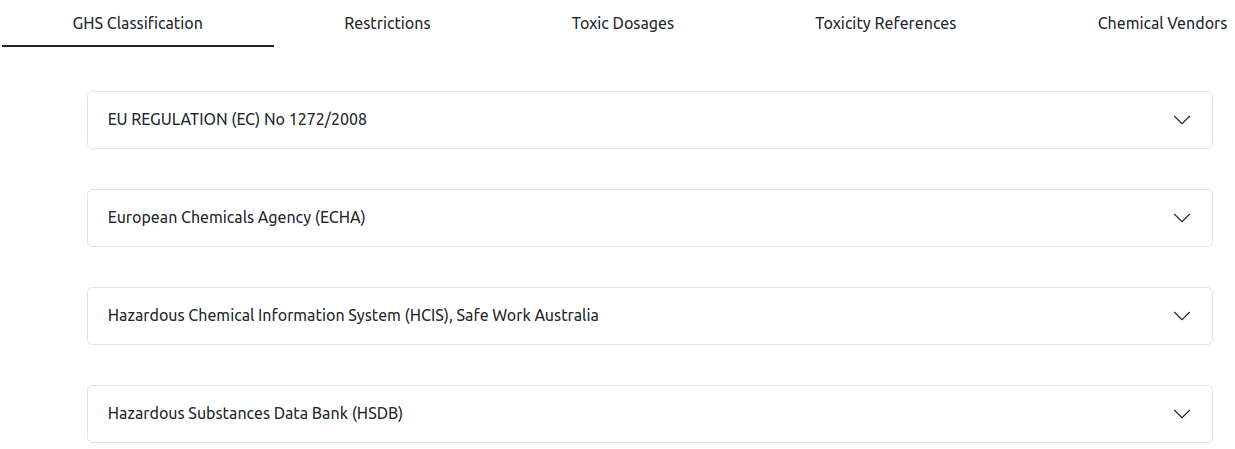
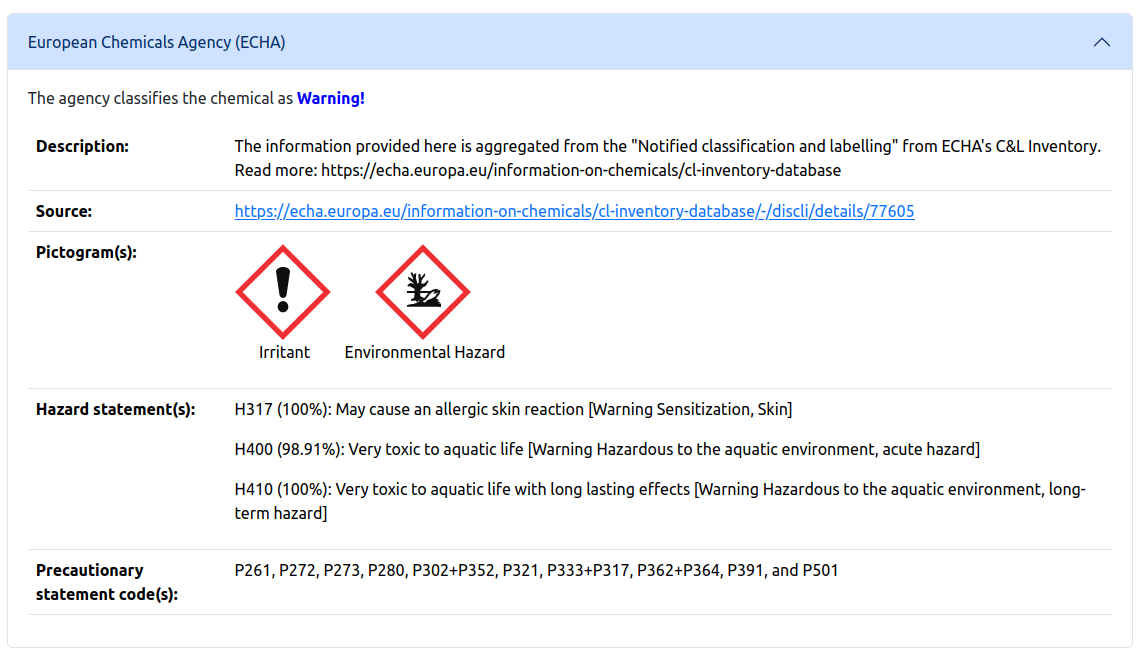
The users are also presented with a set of tables just under the basic section. GHS classification (GHS stands for Globally Harmonized System of Classification and Labelling) is the first table with an example shown in the figure below. The table shows any potential hazard the chemical causes, such as health, fire, environmental hazards, etc. It is important to show this table first and warn the user about the adverse effects of the chemical. The information are given by multiple agencies and here these are presented in saparate drop down tabs. Dangerous chemicals are complemented by hazzard and precationary statement codes.
The second table deals with the restrictions and the governing bodies which define them. The chemical benzene is restricted by REACH what can be seen in the table (the figure below). In general, chemicals which are restricted should not be further researched within VIPCOAT. However, the users are allowed to experiment in the platform even with the most toxic chemicals.

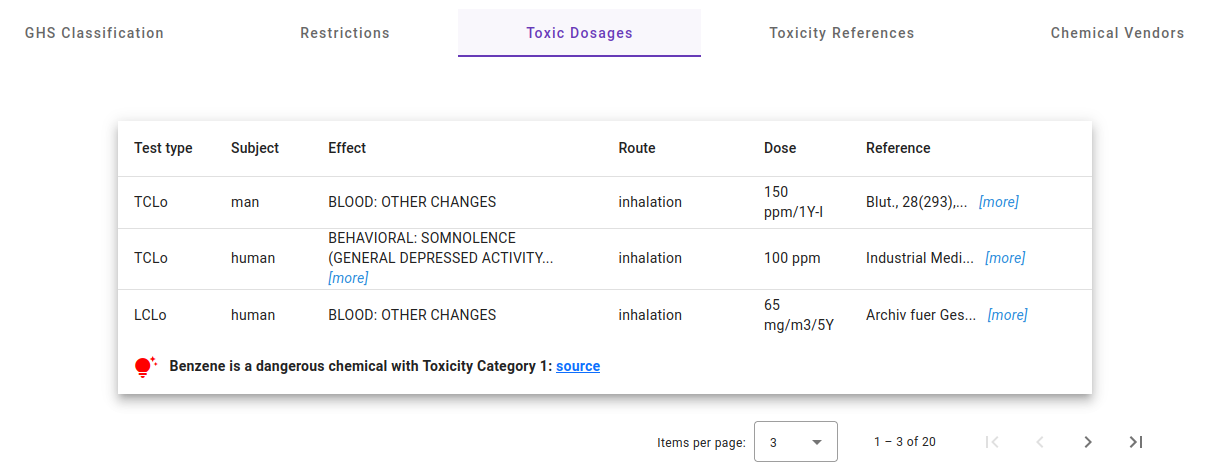
The table Toxic Dosages deals with toxicity categories. An example can be seen in the figure below. The main properties that are relevant are the LD50 (lethal dosage at which half of the tested population died) and LC50 (lethal concentration at which half of the tested population died). This set of information satisfies the toxicity KPI of the use case 1.
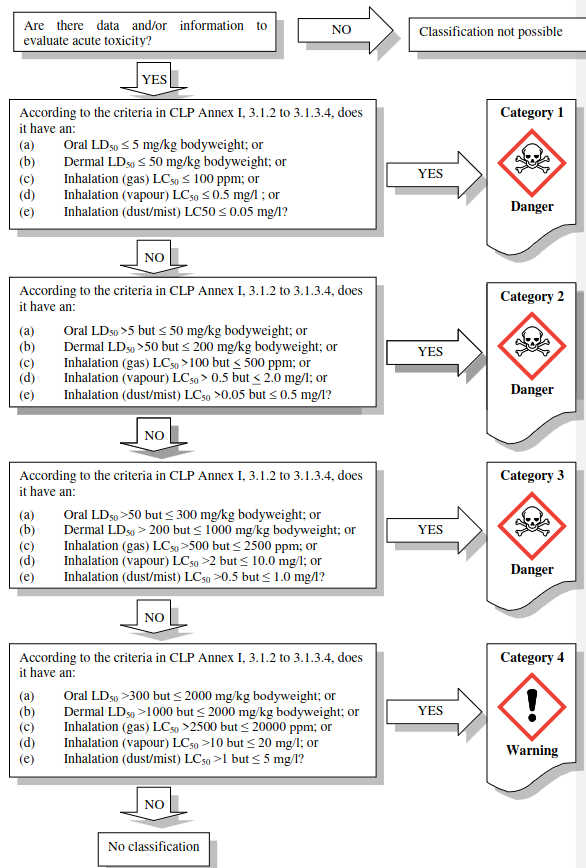
The values are used in the workflow presented in the figure below (taken from the following source ). The data are queried from external data sources provided by PubChem. The chemical in this example is extremely toxic, restricted, and is assigned a category 1. The data on which this decision is made is shown in the table above, citing the sources. Moreover, the source for the workflow of the classification is presented to the users as well. This gives users even more information on the chemical and how should the chemical be treated. A disclaimer should be made here that VIPCOAT takes the information from external sources and the category provided by the platform should be treated as a reference only. The recommendation is to double check the values with the experts.
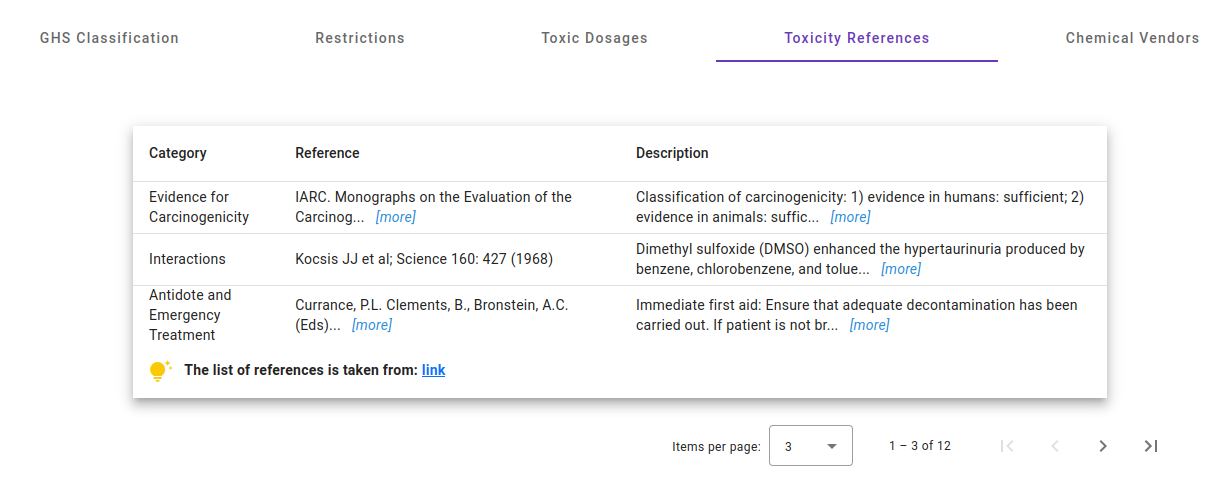
The Table Toxicity References gives additional information on the adverse effects of the chemical. It is a comprehensive list of references with description and sources as can be seen in the figure below. The goal of this table is to give users sources where they can further investigate the toxicity of the chemical.
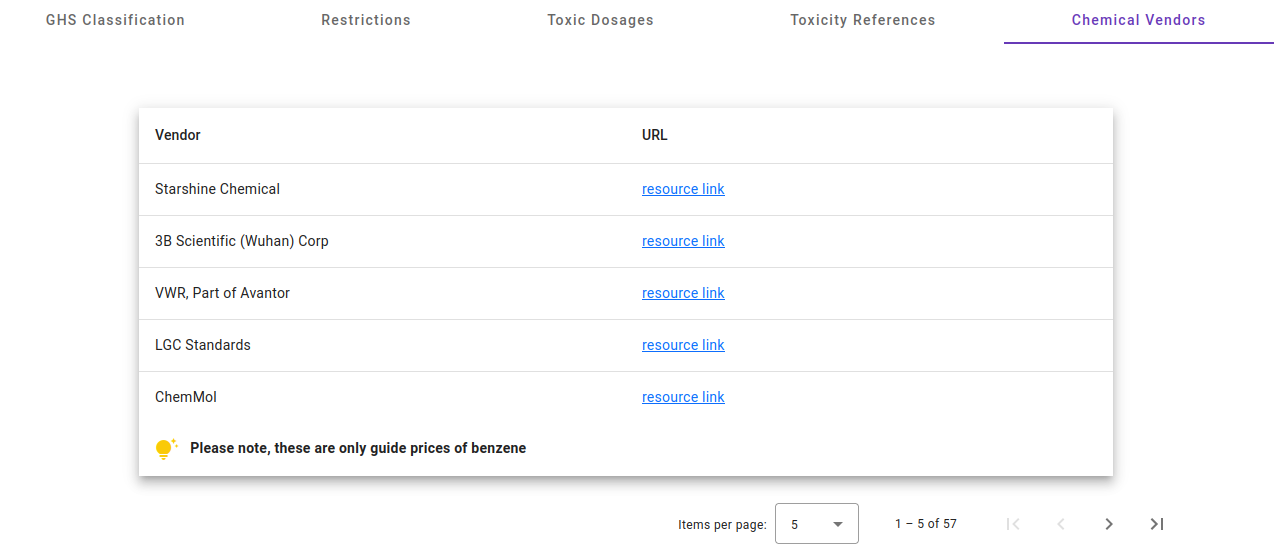
The last table in the set is the Chemical Vendors table (the figure below). The table focuses on the KPI dealing with the price. It provides names of the companies which sell the chemical and the link to their web-pages. It should be stated that VIPCOAT cannot provide accurate pricing of chemicals since this is unique to the case and depends on the agreement between providers and buyers.
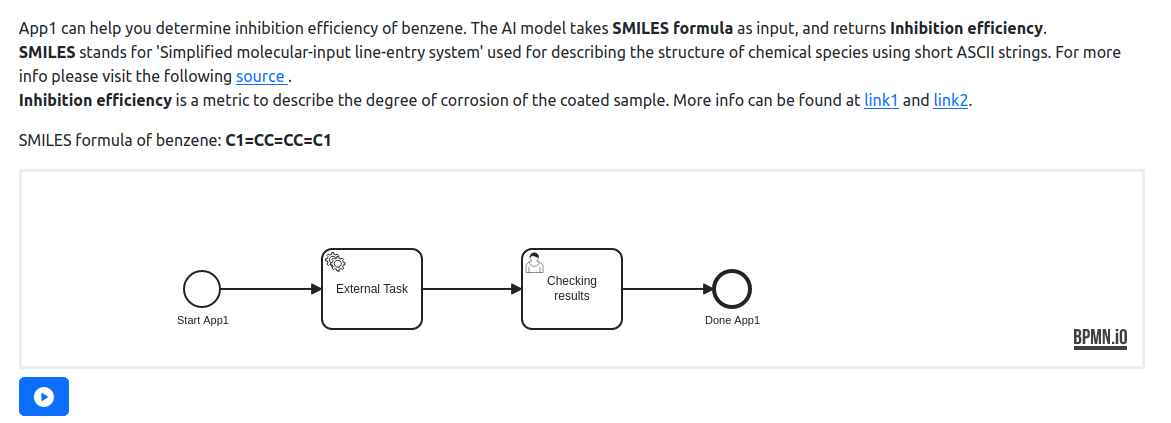
In the simulation part of the page (the figure below), the user is allowed to run a simulation to compute the chemical’s inhibition efficiency. This is enabled via the REST API connection to Camunda. The first property that is fetched from Camunda is the BPMN diagram that is presented in the page via the BPMN.io Angular adapter. The ‘play’ button runs a process instance in Camunda, defined by the BPMN diagram. The business logic behind the process sends a trigger to the computational unit where the source code of the simulation software is stored to be executed. In the case of App1 this is the Machine Learning Python code. It requires SMILES formula of the chemical as an input which is automatically queried by the app1 landing page from the name of the chemical.
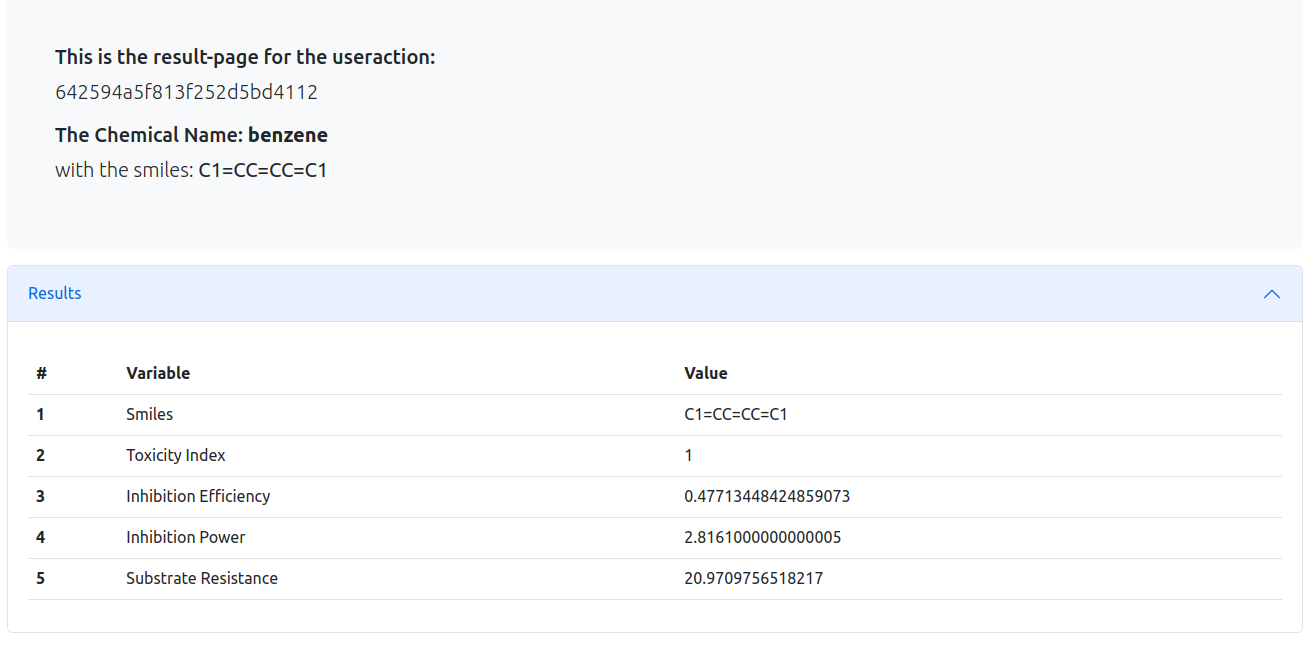
The simulation result is provided to the user in the form shown in the figure below. The simulation with its details is saved in the Database, and is available to the user at the simulation history at userpage. The app1 simulation deals with the evaluation of how well does a chemical inhibit corrosion. This is done with the metric called inhibition efficiency. However, other metrics are computed as well, in particular the inhibition power, and the resistance measured at the inhibited substrate. Moreover, the value of the toxicity category is passed to the simulation when a simulation is requested and this value is stored in the simulation history.
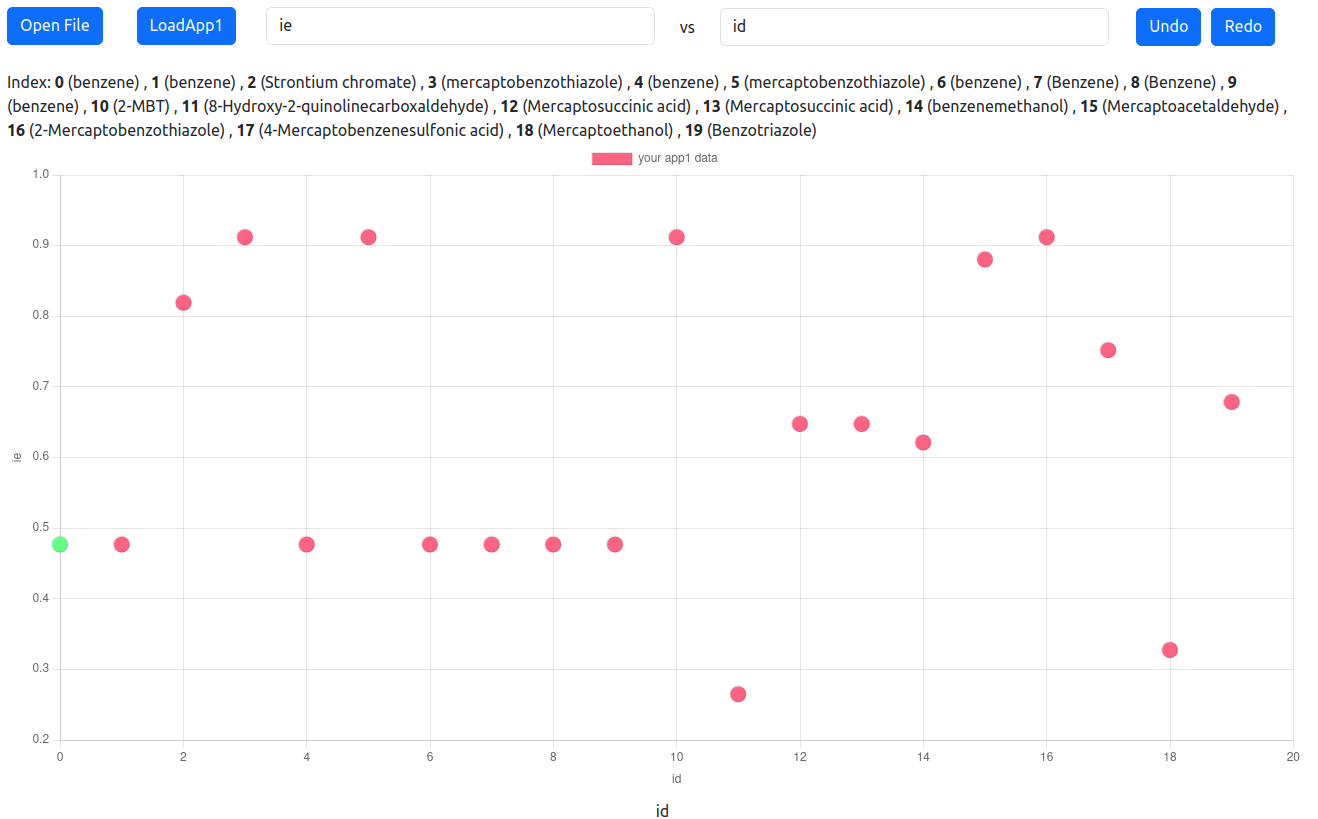
The app1 is further implemented to the Business decision and support system (BDSS) where users can take a better look at the simulation results they have carried out for app1 as shown in the figure below. The button “LoadApp1” checks the user simulation history and prepares the app1 results for plotting in the graphing area. Each of the results is recognizable by its id connected to the chemical name with the list of chemical names above.
Use case 2
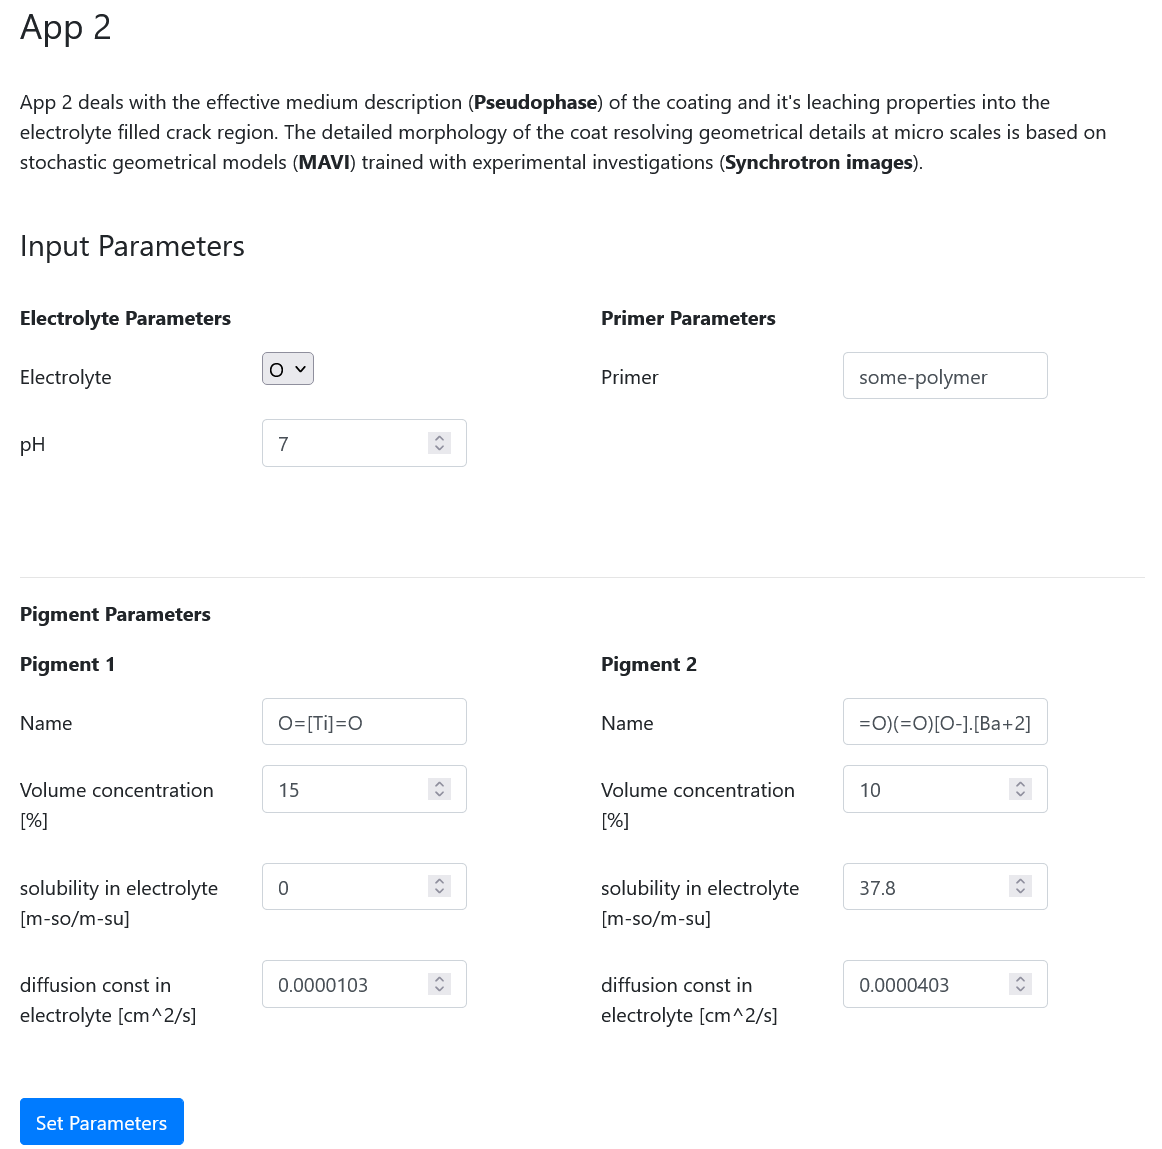
Use case 2 deals with the effective medium description (Pseudophase) of the coating and its leaching properties into the electrolyte filled crack region. The detailed morphology of the coat resolving geometrical details at micro scales is based on stochastic geometrical models (MAVI) trained with experimental investigations (Synchrotron images).
At this point, the interface to the use case webpage is designed and implemented, although the backend simulation is still not fully available. The idea is to follow standard software engineering practices to implement a component according to a predefined user interface. This interface is written in Python, the backend simulation tools (MAVO, ParPac), to be adapted to the needs of VIPCOAT, are mostly written in C++.
The input parameters for the simulation are collected in the form. Once the user confirms the parameters they are presented with the simulation part of the webpage. Here they can start an instance of the simulation. Once the simulation finishes, the results will be ready in the results page.
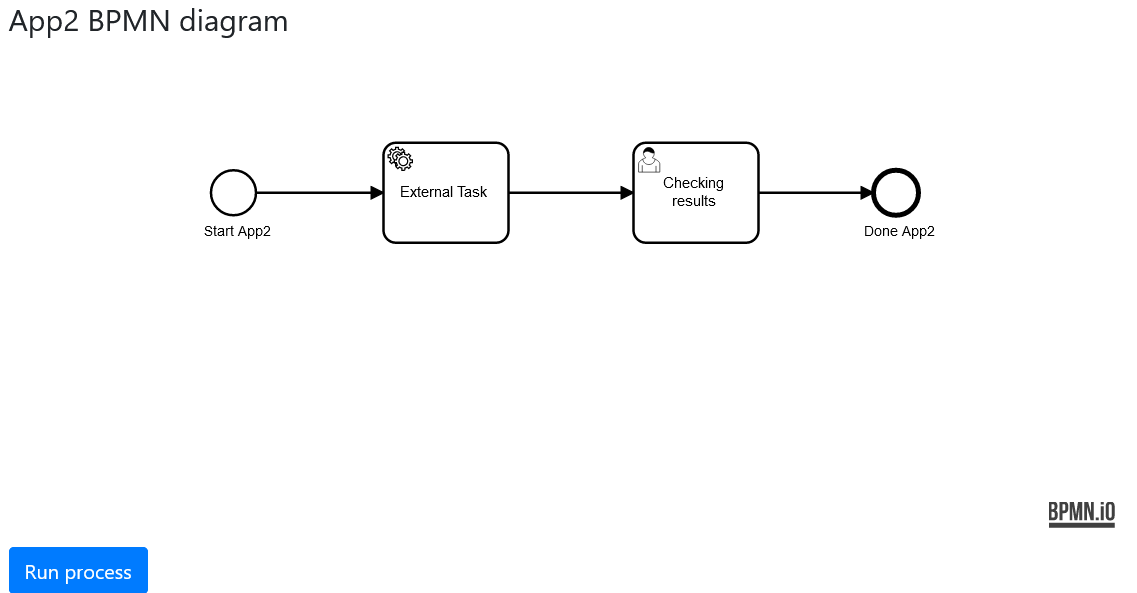
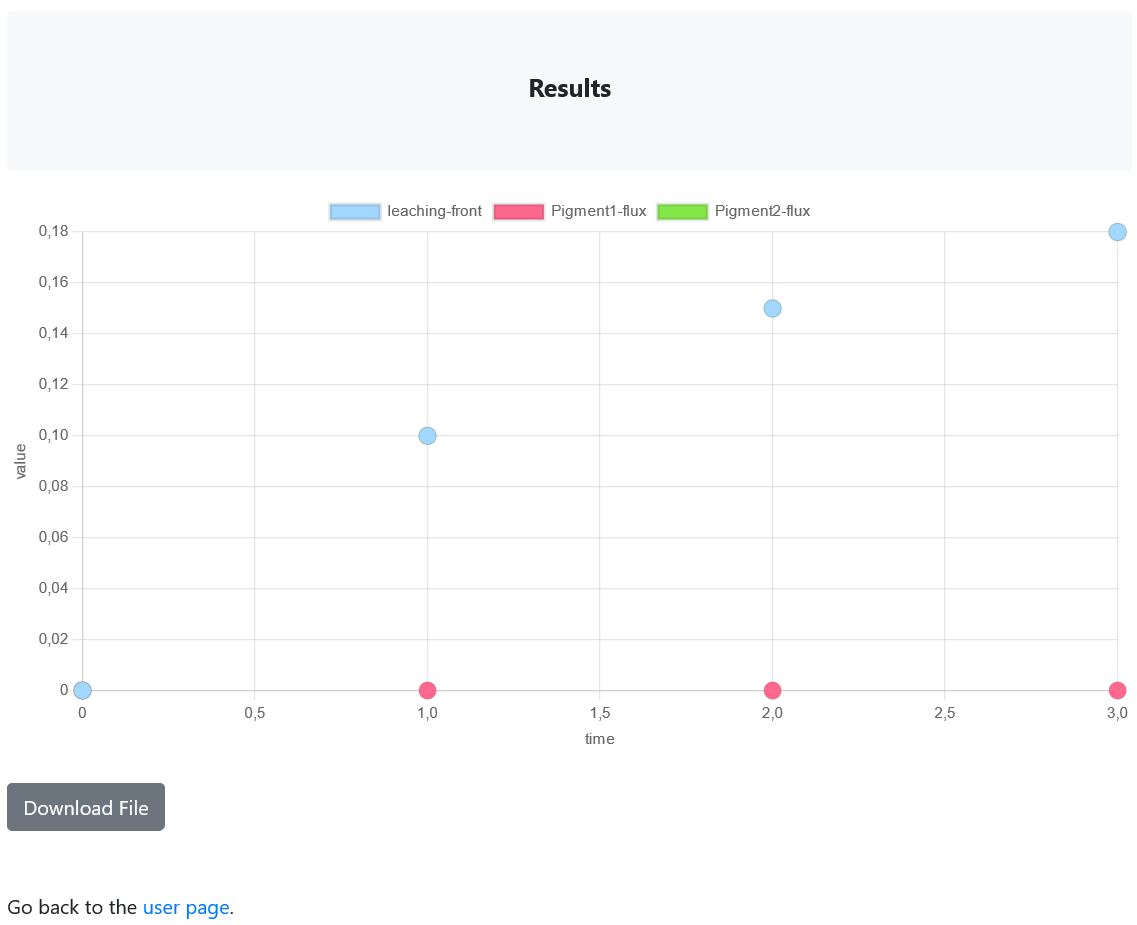
The results for use case 2 come from a leaching simulation based on MAVI generated synthetic morphologies. The raw results represent the leaching front and the individual pigment flux that change over time. To present these results the data is rendered in the web-site as an interactive graph.
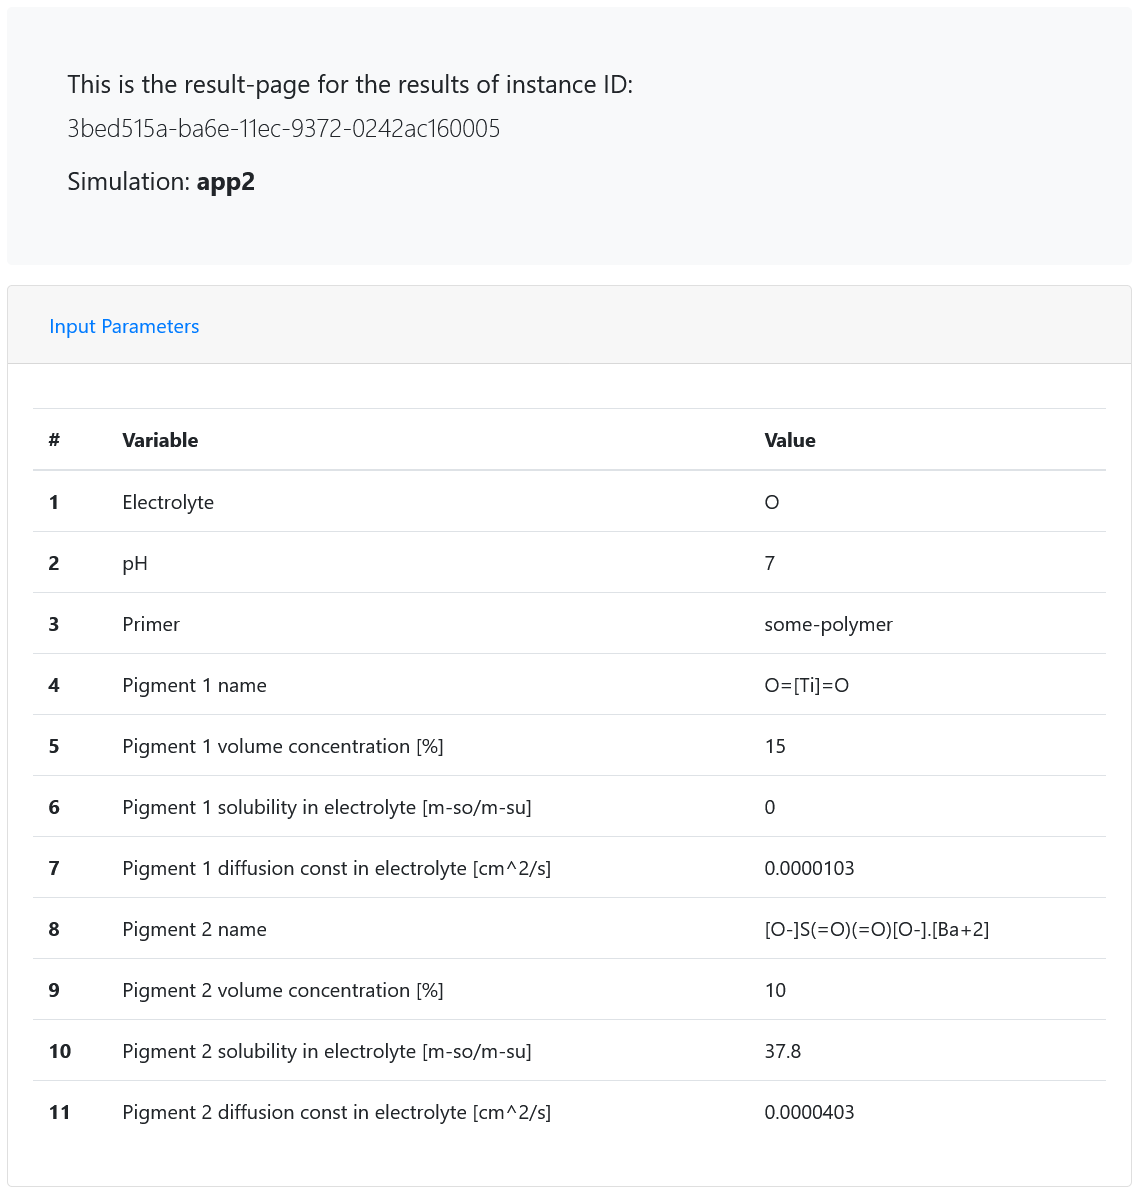
Even though the numerical model for the use case 2 is written in Python, the external worker is written in JavaScript to handle more complex data exchange between the Simulation layer and the front-end application. The external worker code covers the following steps:
fetch input parameters for the simulation. Since there are many input parameters, the individual lines of code are not shown;
once all parameters are loaded they are compiled into an input JSON file that is fed into the use case 2 simulation model;
after the simulation, the results are loaded and sent back to the end-user via Camunda. With this step the external worker completes the task.
Use case 3
The use case 3 deals with the multi-ion simulation of coatings. Different anti-corrosion pigments are considered and its influence is calculated on coating defects over a metallic substrate. The simulation is based on the Nernst-Planck governing equations and the electro-neutrality. The leaching parameter update is done on a macroscopic timescale, while the detailed diffusion simulation timesteps are handled on an amesscopic timescale.
The input parameters for the simulation are collected in the form. The interactive canvas allows users to visualize the input parameters. Once the user sets up the geometry they are presented with the simulation part of the web-page. Here they can start an instance of the simulation. Once the simulation finishes, the results will be ready in the results page.
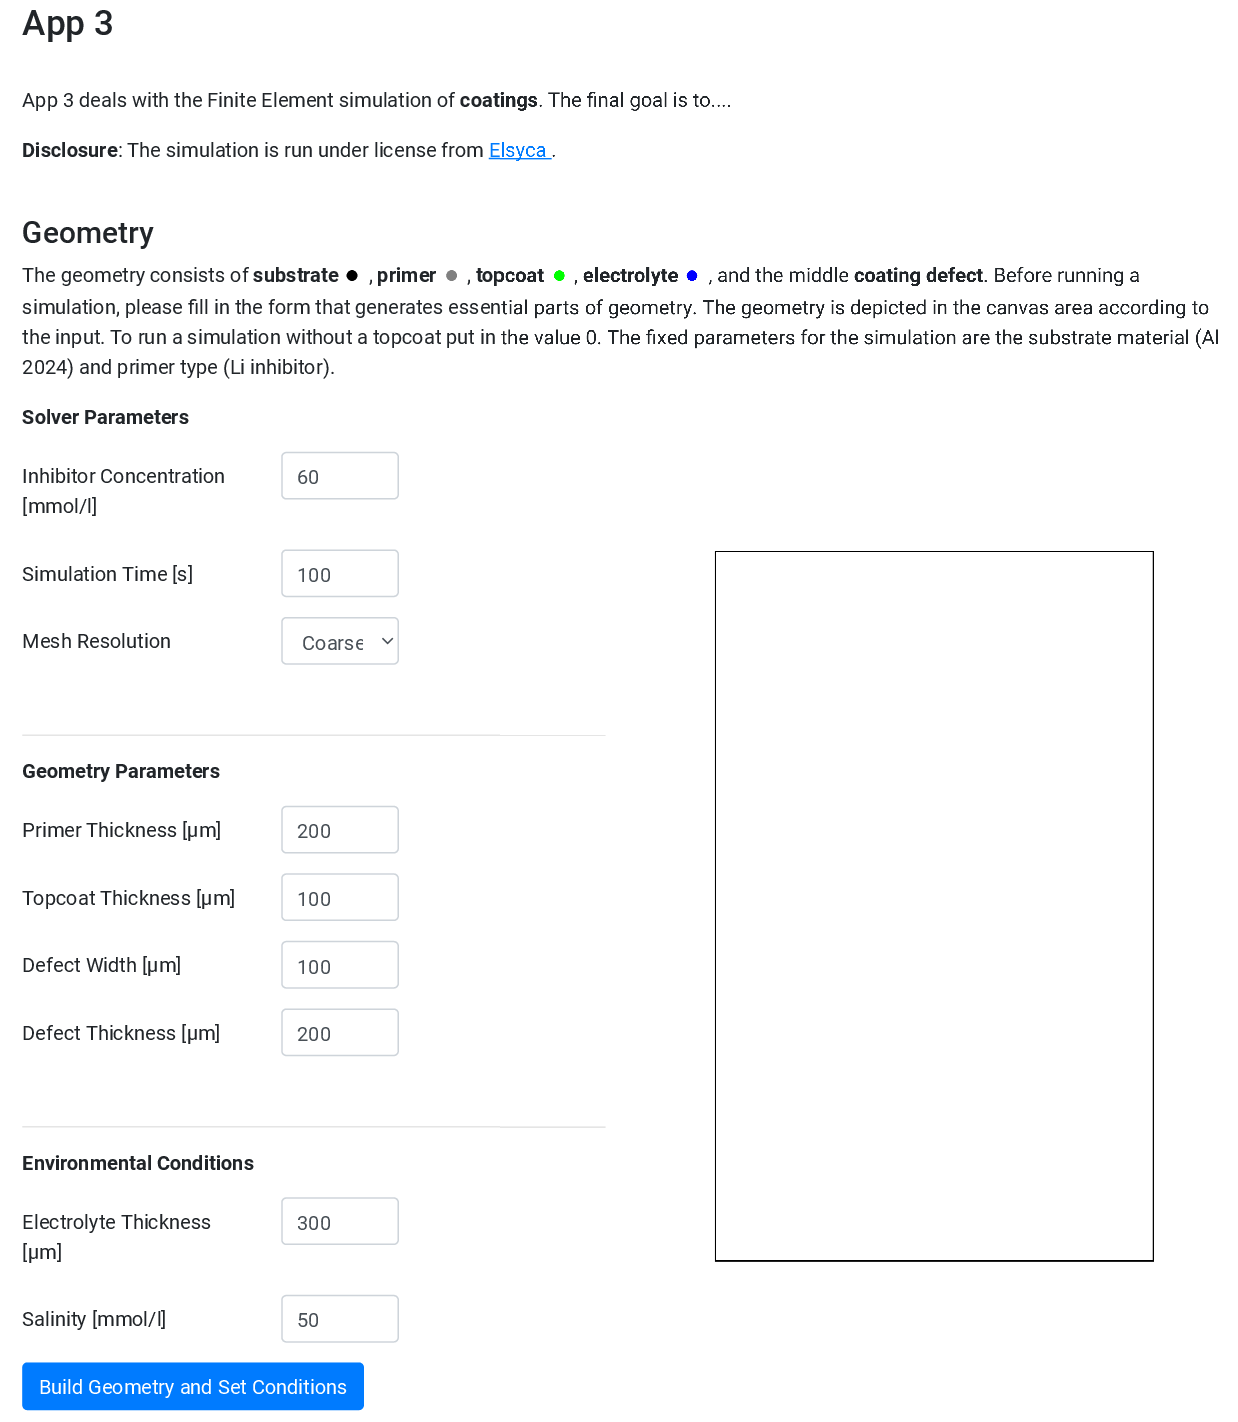
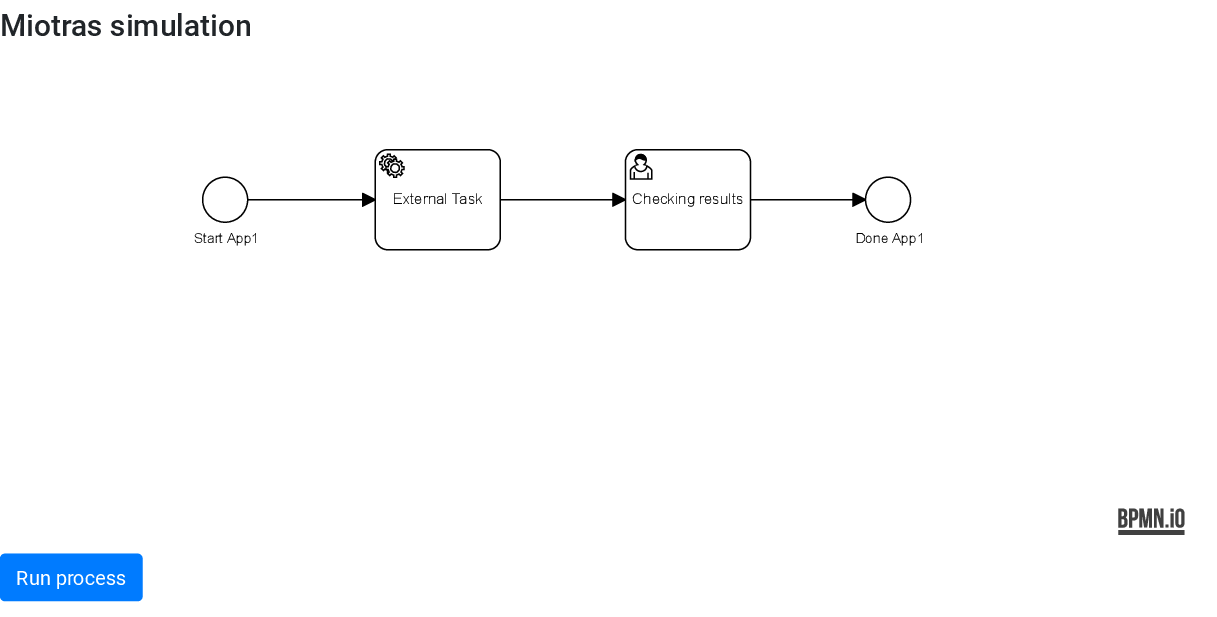
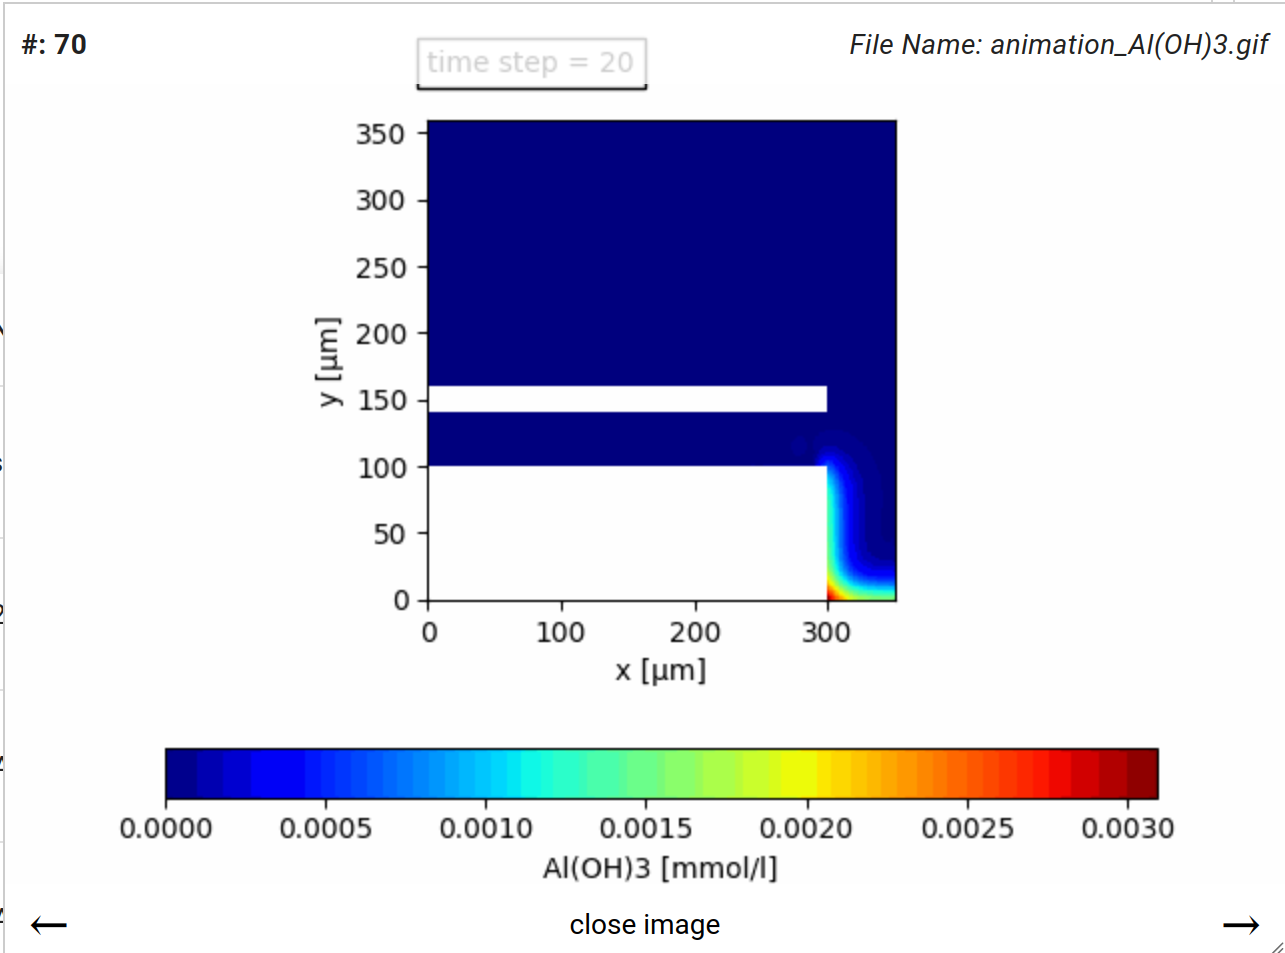
The results come from 2D Finite Element simulations. At the beginning the same input form is repeated. The post-processed results are shown underneath. The raw results from the simulation resemble a 2D field that changes in time f(x, y, t). To present the more complex results, a couple of visualization techniques are developed. Once the requested simulation finishes, the raw data are passed to a Python post-processing script. The script reads the data for each time step and renders a 2D image for that time step. When the images are created for all the time steps they are merged into a single animated gif file. Moreover, the post processing script creates a csv file with the spatially averaged concentrations. The csv file is rendered in the website as an interactive graph where the user can choose what should be plotted in the axes. The user can also choose the axis scale (logarithmic, or linear).
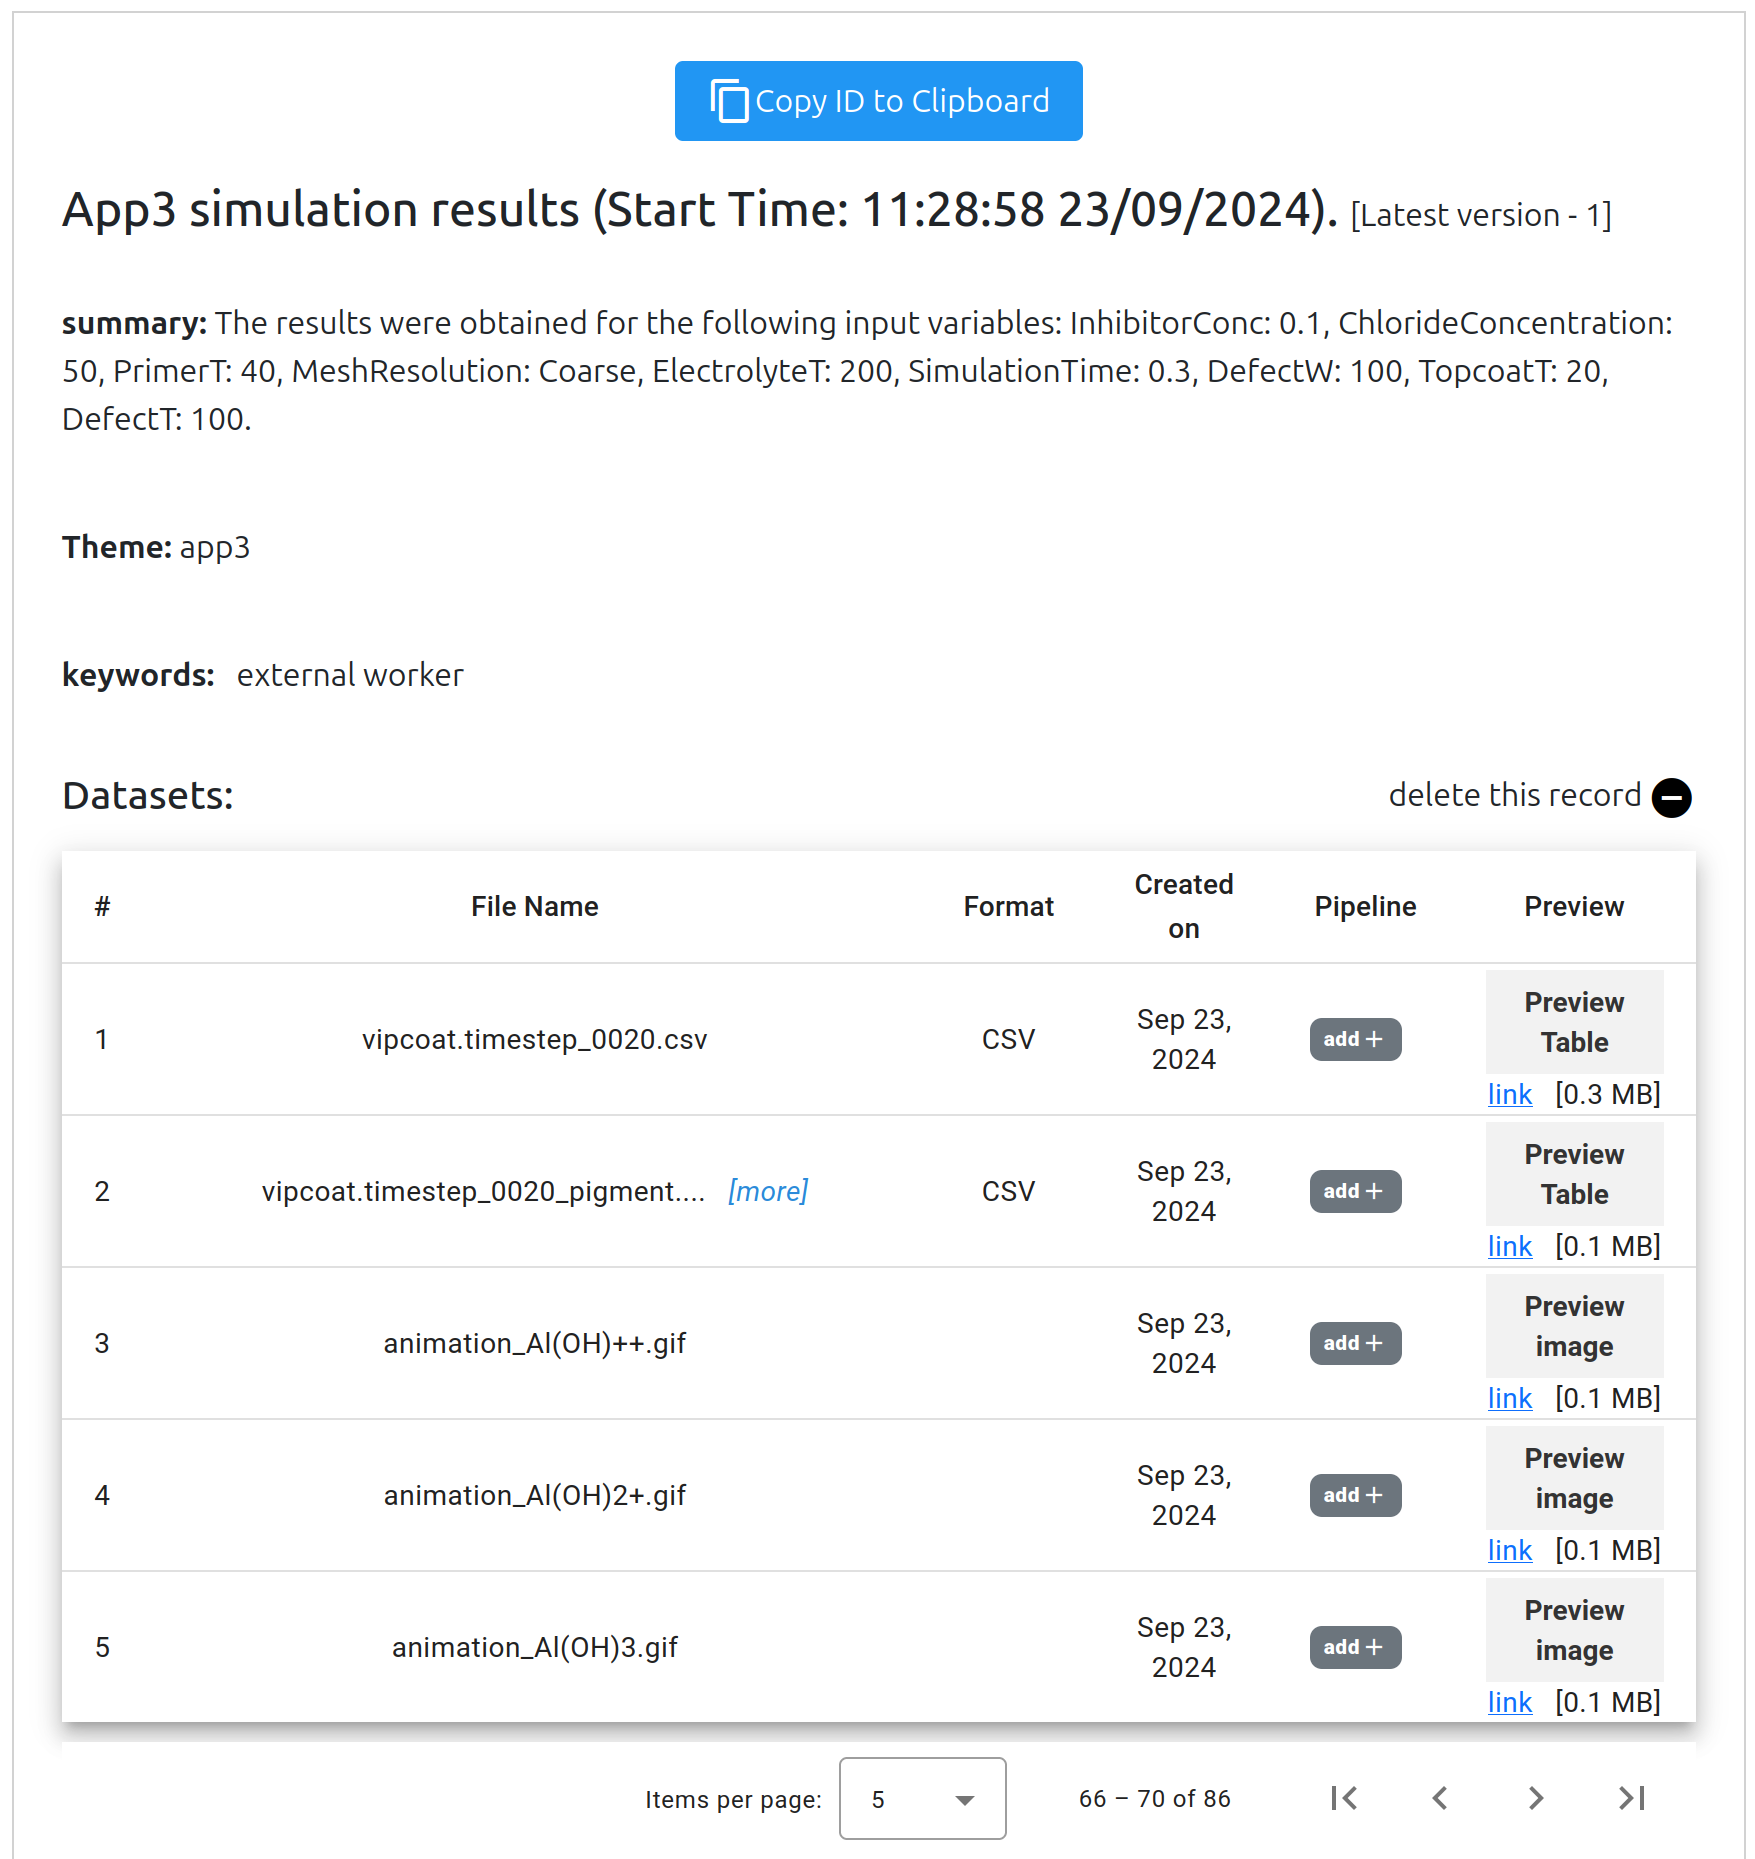
The animations are presented as following data catalog visualization
The tables are presented as following data catalog visualization
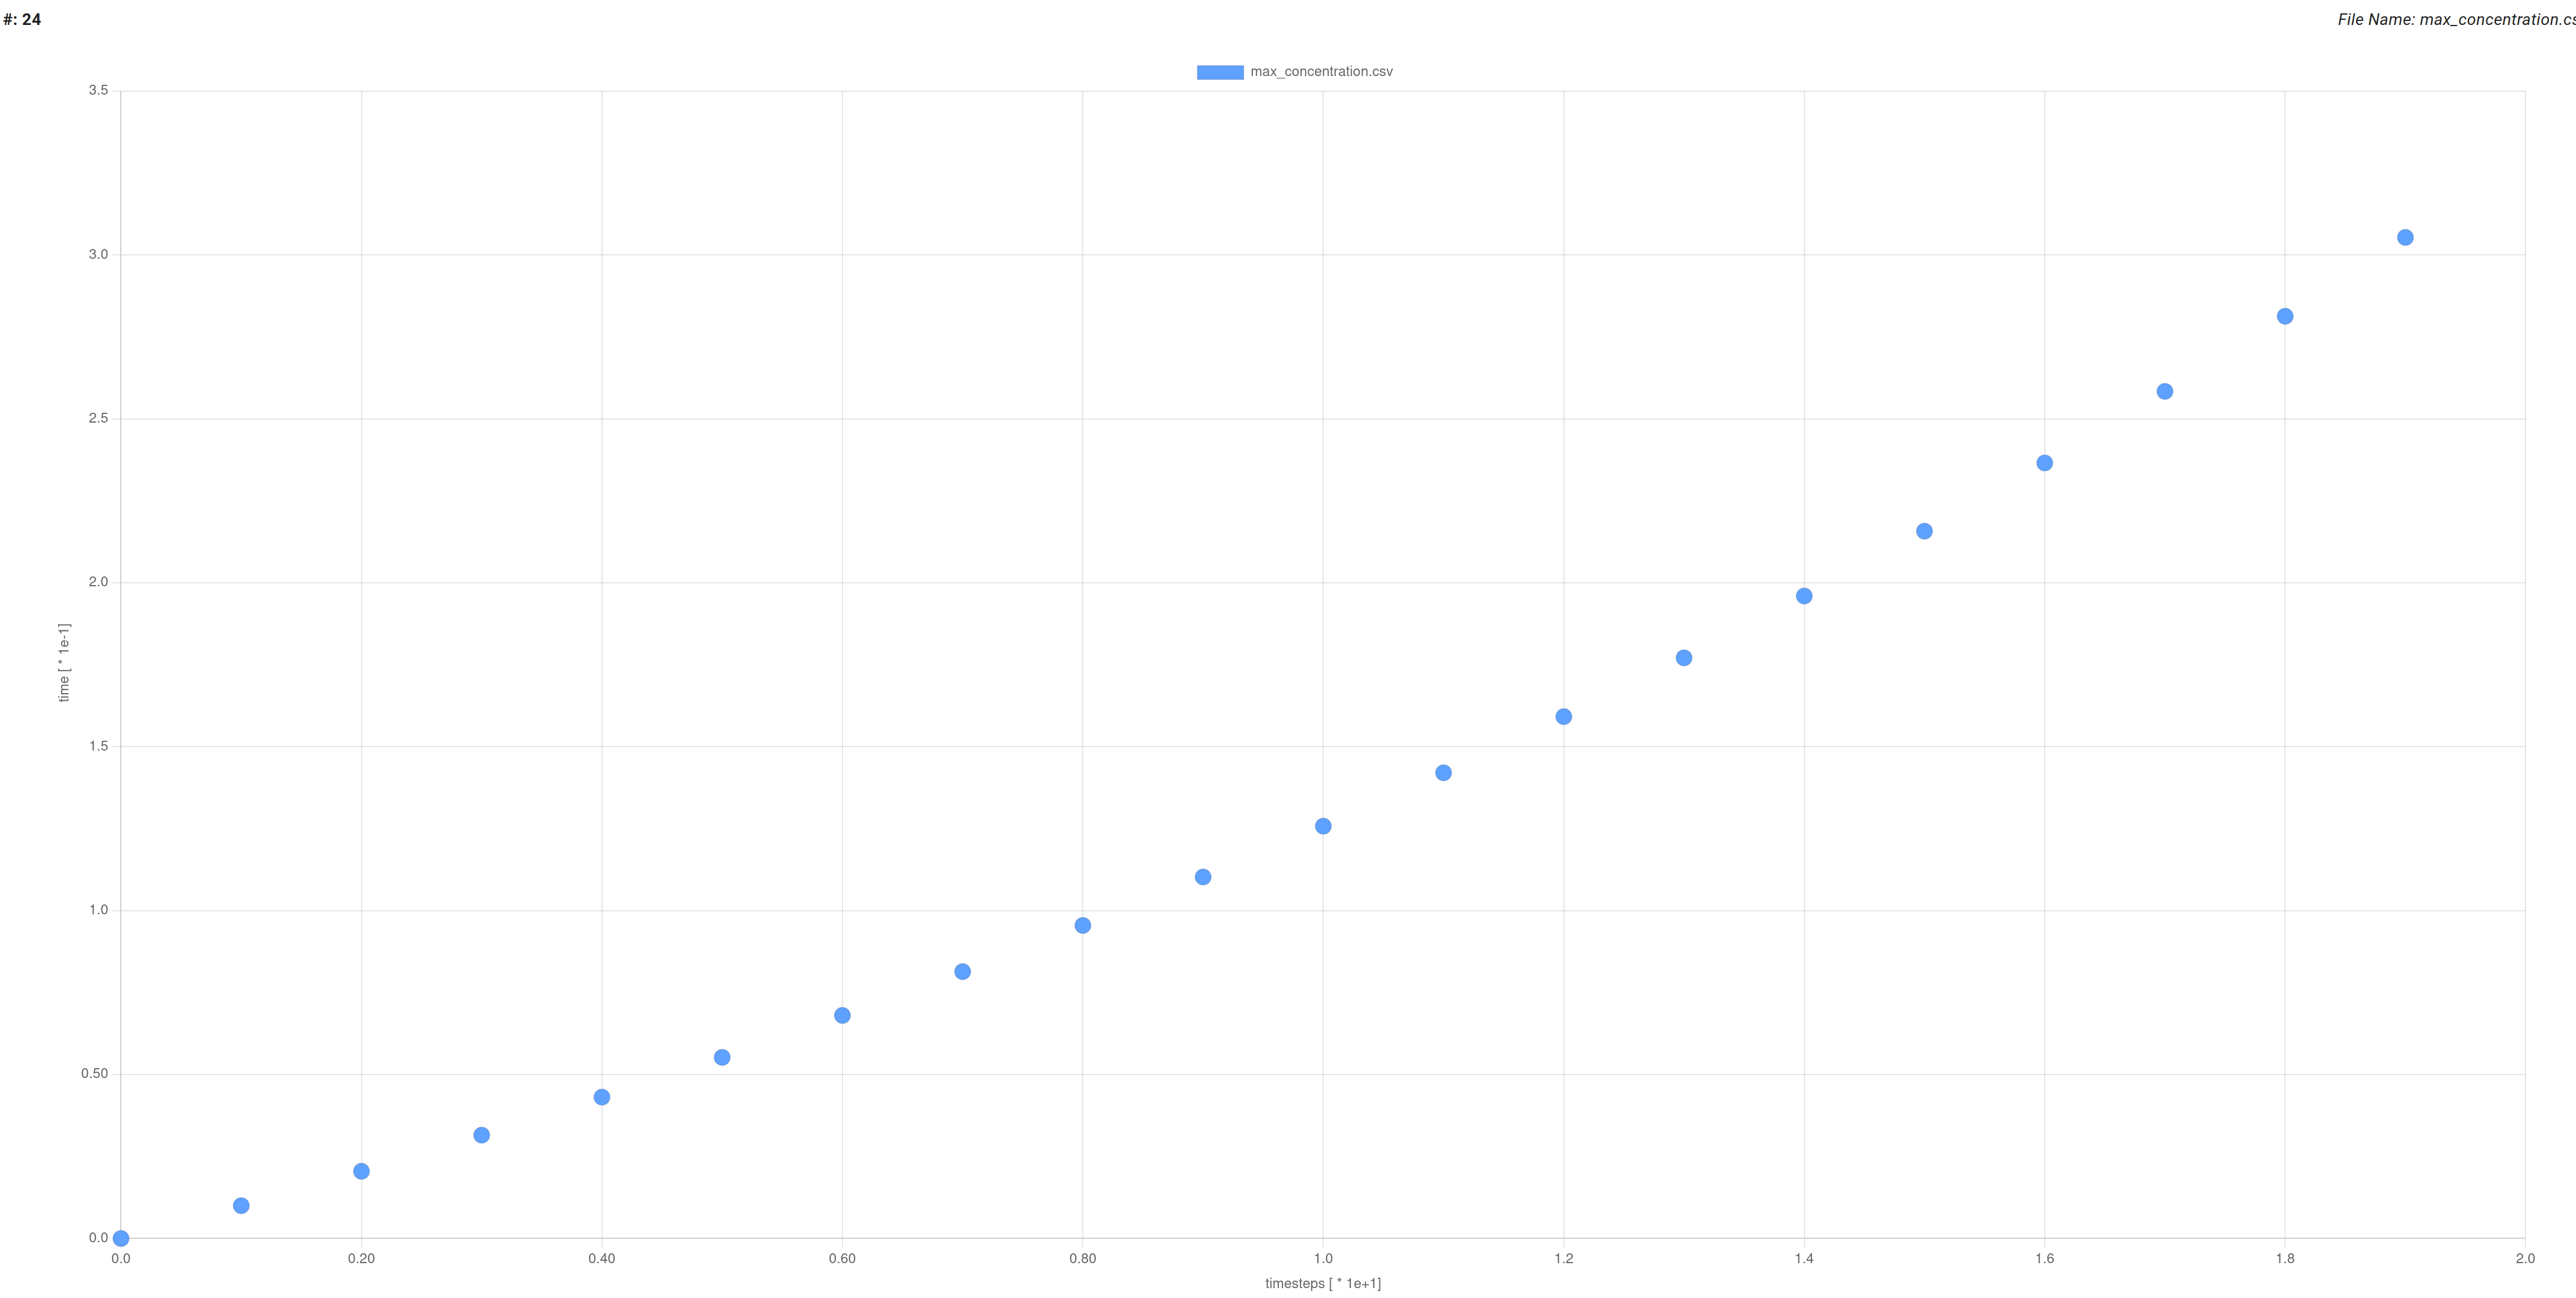
The External worker for use case 3 is similar to the previously described workers. The worker is written in JavaScript since some of the essential functionality does not exist in the basic Python external worker. The worker code covers the following steps:
fetch the input parameters for the simulation. Since there are many input parameters the individual lines of the code are not shown. The input parameters are used to compute derived parameters such as the height, width, and grid density of the computational domain and the time steps of the simulation;
once all the parameters are computed they are used to modify the input xml file that is fed into the MioTras simulation software;
the input file is essential and the only file required to be modified before the simulation;
after the simulation, the worker calls Python post-processing script that reads the outputs of the simulation and writes the csv table containing space averaged results and the animation showing how inhibitor concentration changes in the parts of the coating, defect, and electrolyte;
finally, the results are sent back to the end-user via Camunda. With this step the external worker completes the task.
Use case 4
Use Case 4 (or App4) is a Physics-based modelling workflow for cyclic corrosion tests. Based on Dynamic Electrolyte Film Corrosion (DEFC) model results, the Explicit Time Integration Cyclic Corrosion (ETICC) model predicts the full corrosion model (App 3) under accelerated corrosion conditions. Two accelerated corrosion testing protocols can be selected as an input for the ETICC model based on VDA 233-102: VDA-I (sequence ABACABB) and VDA-II (sequence BACABBA). The VDA 233-102 is a cyclic corrosion test for materials and components in the automotive construction, and the test is created jointly by the automotive, steel and aluminum industries. The test consist of 3 subs-cycles with different temperature and relative humidity evolutions. More information about the test and the sub-cycles can be found on https://www.vda233-102.com/ and https://iopscience.iop.org/article/10.1149/2.0951709jes (N. Van den Steen et al., Journal of the Electrochemical Society, 2017). More information on the DEFC model can be found in http://dx.doi.org/10.1016/j.electacta.2015.11.010 (N. Van den Steen et al., Electrochimica Acta, 2016). More information on the ETICC model can be found in the upcoming publication.
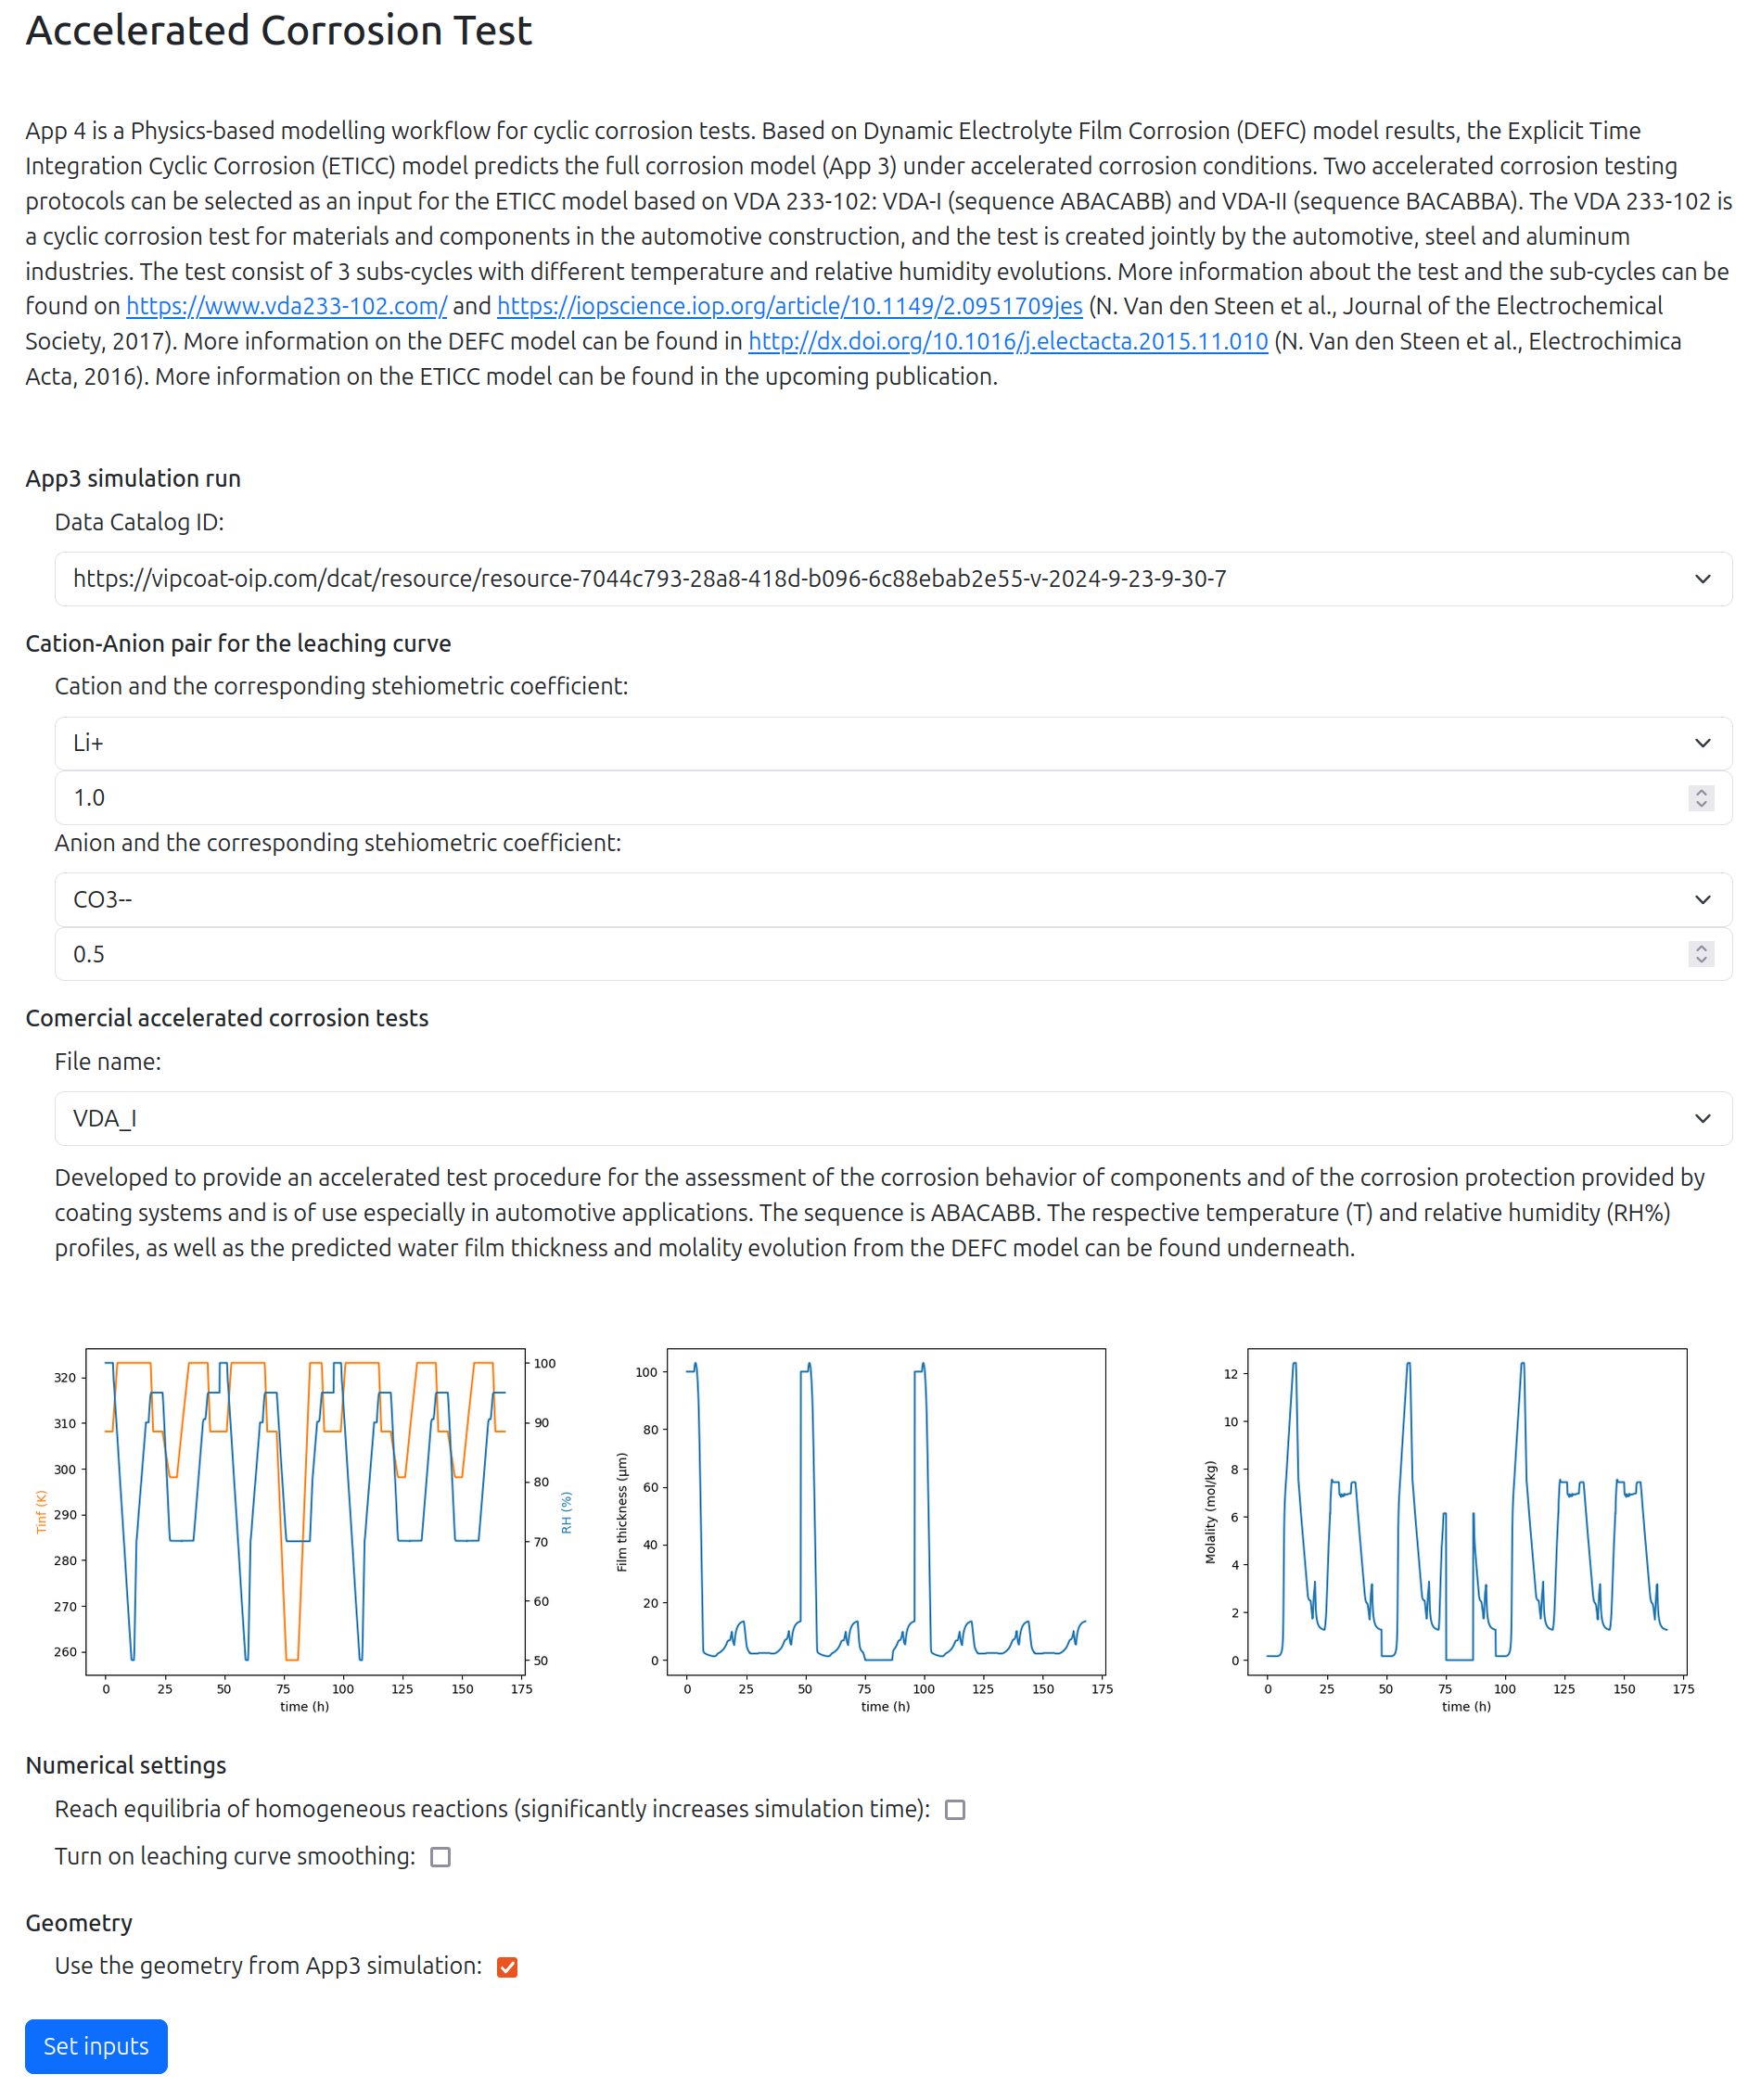
The implementation has been done on top of Use Case 3. The platform will give you an option of choosing previously executed Use Case 3 simulations and will take all the required inputs from your data catalog record of results.
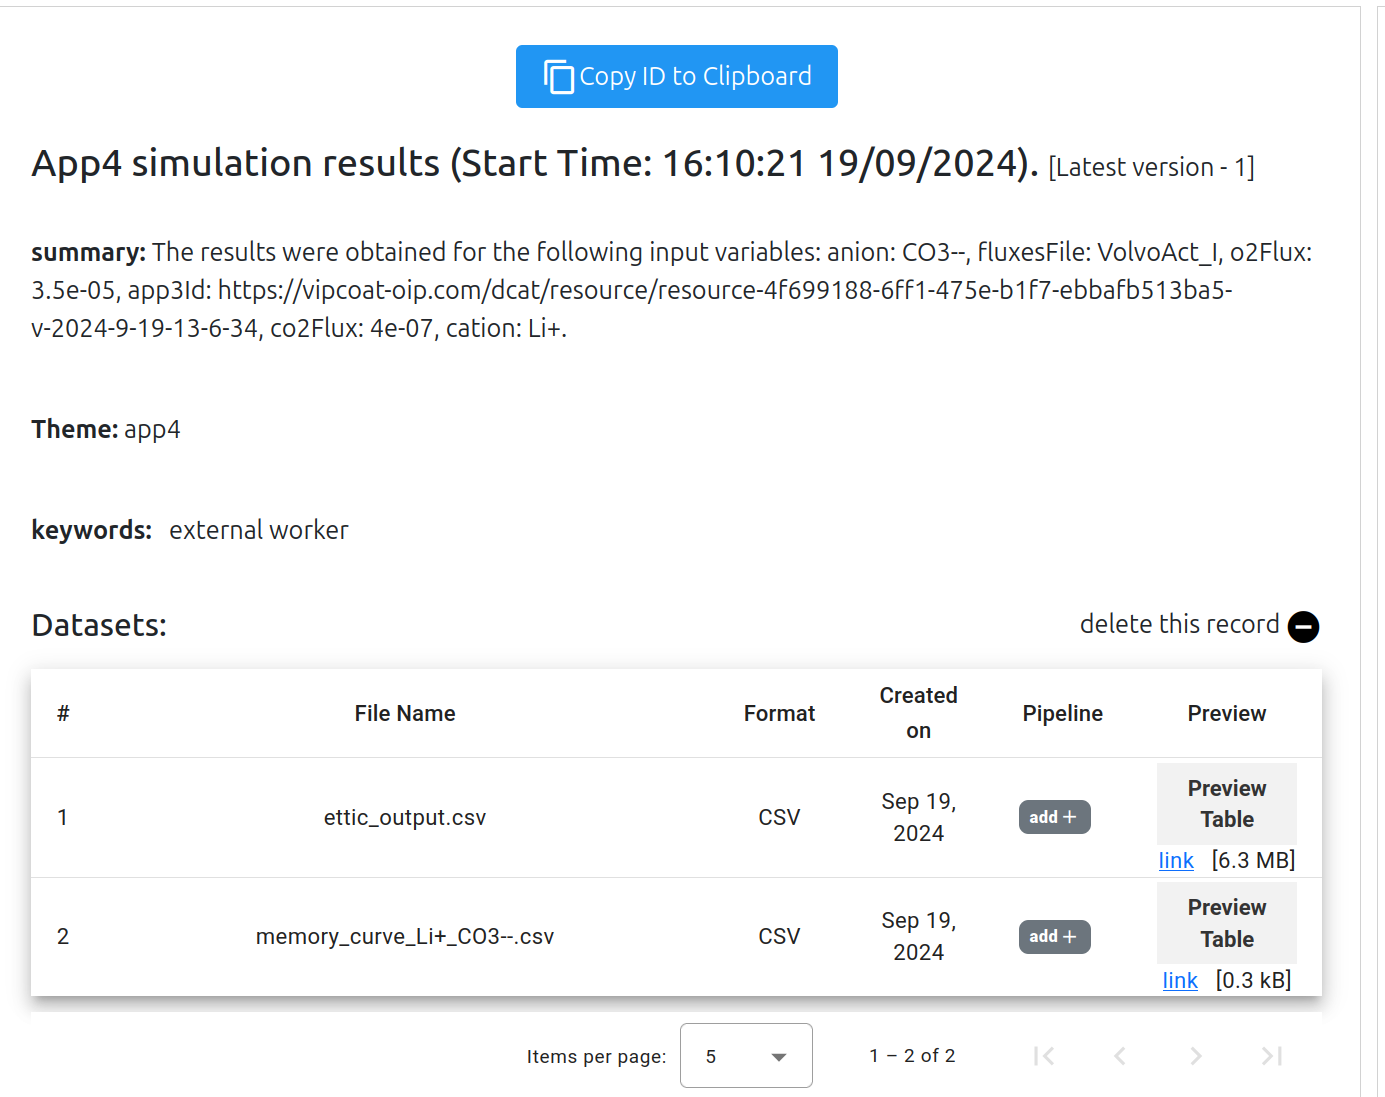
Simulation History
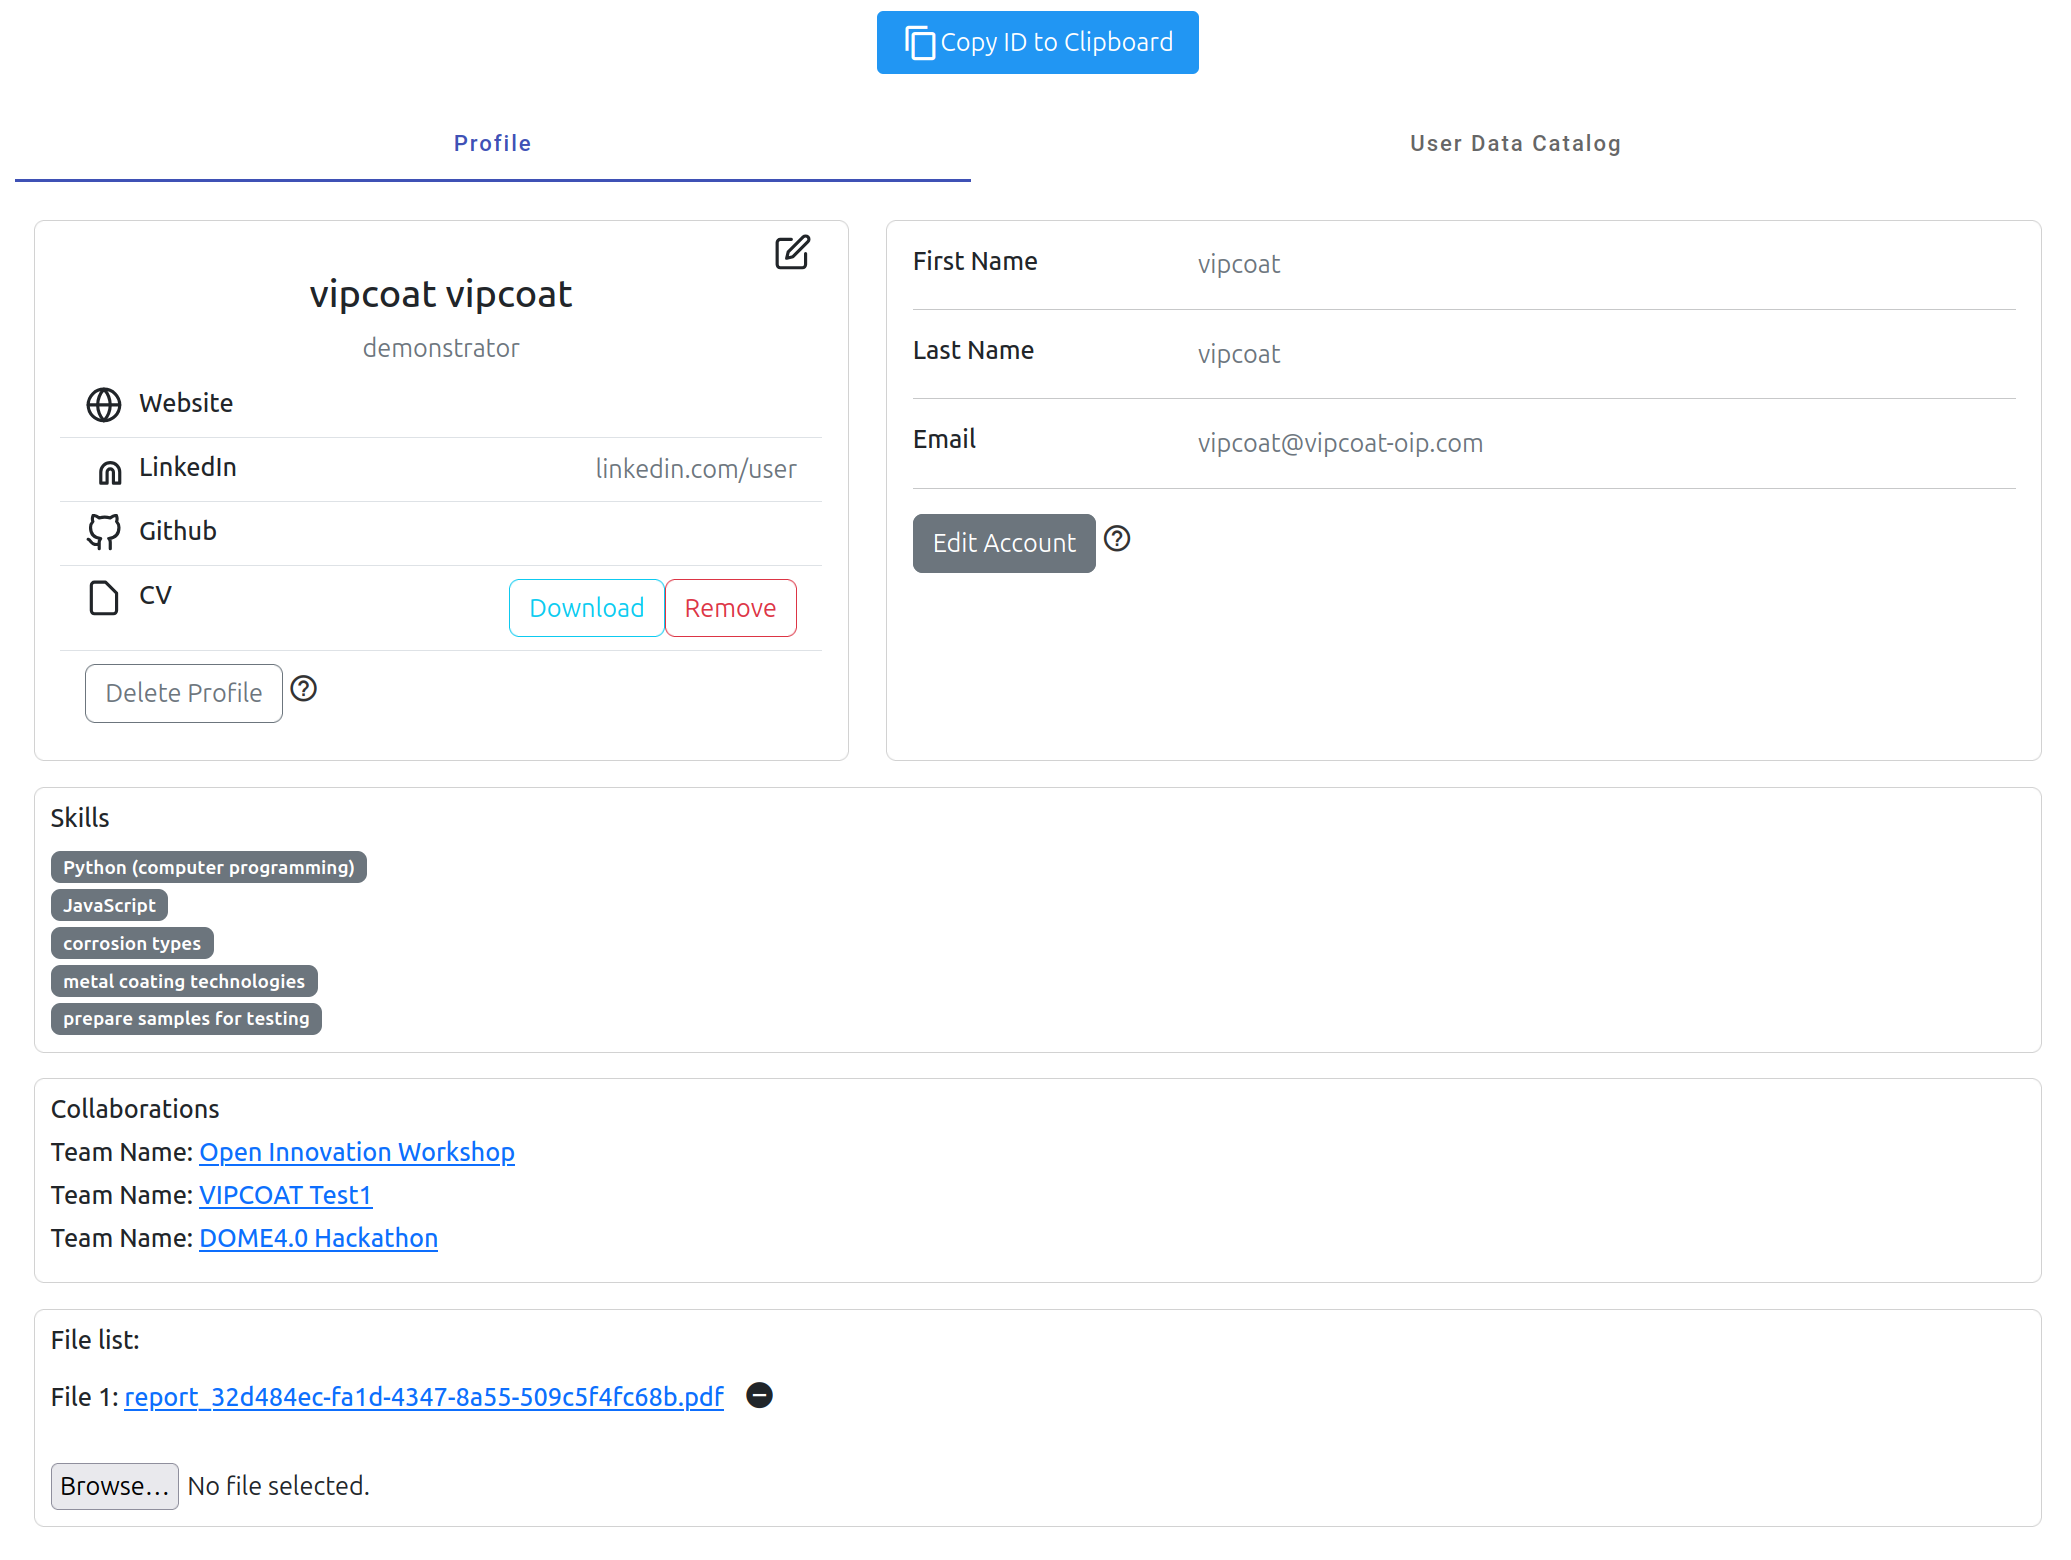
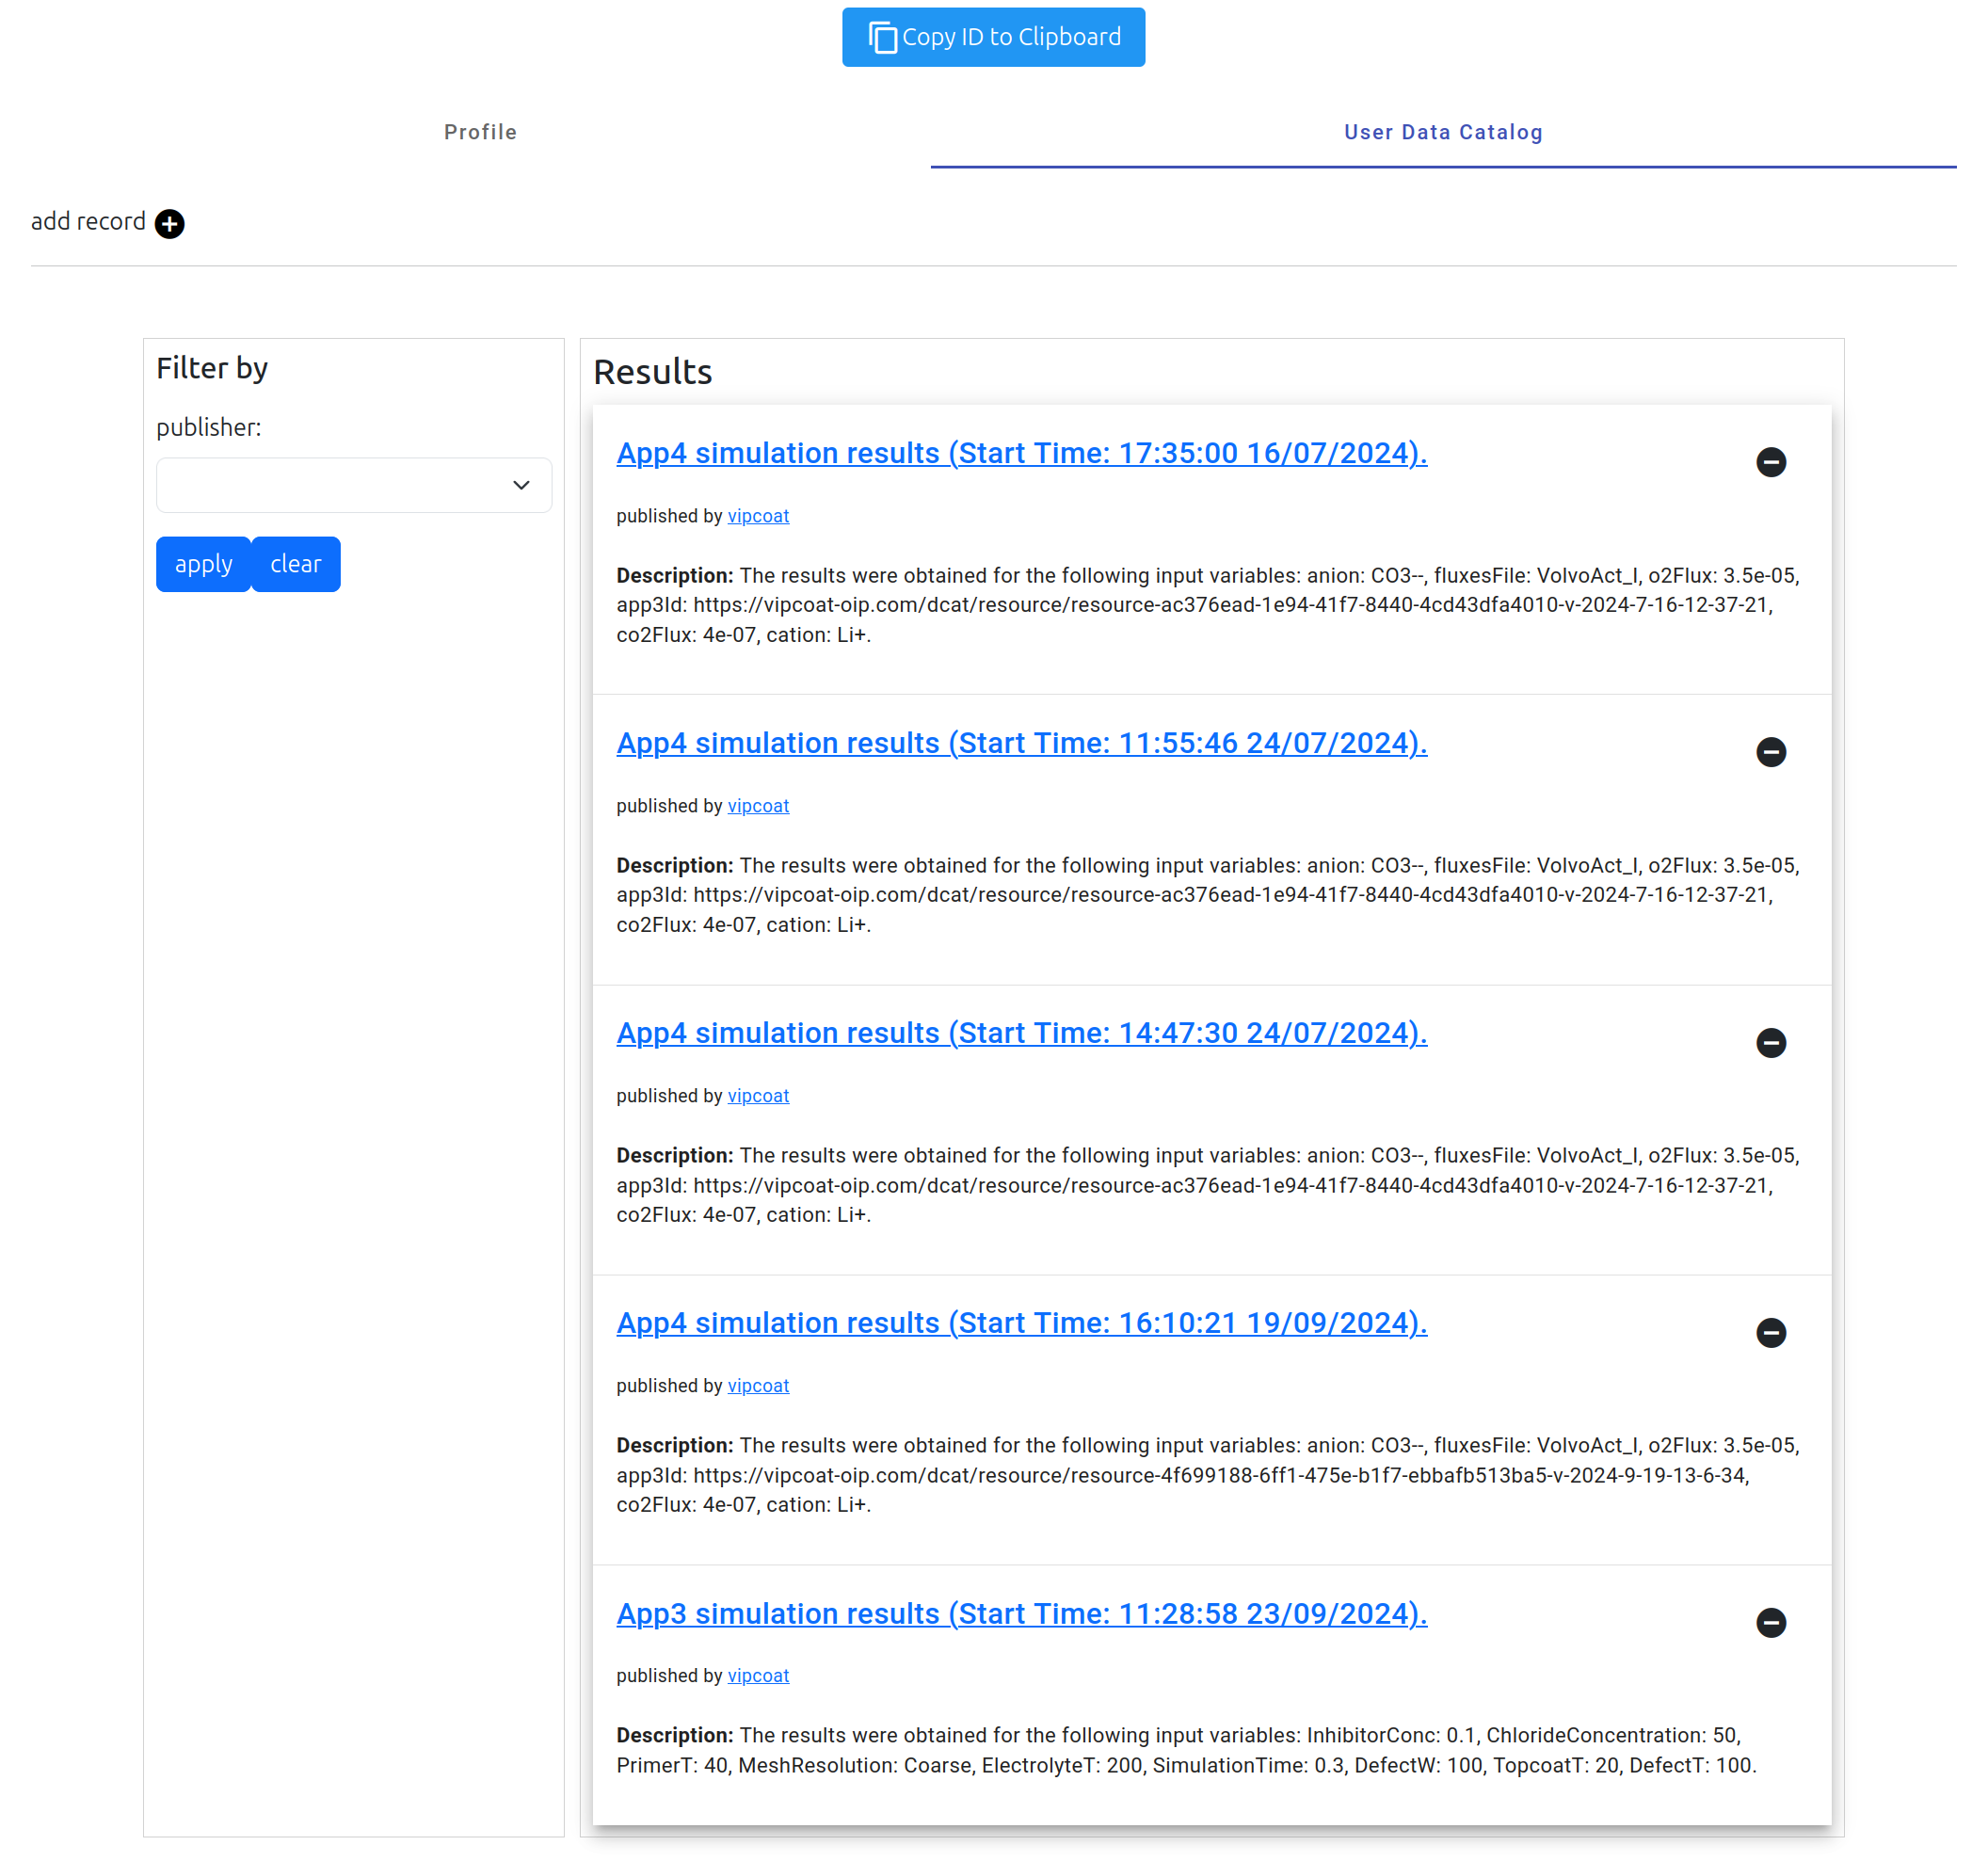
A user simulation history is stored in the data catalog. For example, when Use Case 3 or Use Case 4 are executed the complex results with many included files are stored in the user data catalog. This allows users to smoothly browse through all the generated results and use the data stored in the data catalog as inputs to the next service. This is exemplified by the implementation of Use Case 4. Many inputs of Use Case 4 simulations are taken directly from the results of Use Case 3 stored in the user data catalog.
The available data catalog resources can be browsed in the user profile as shown in the following image
